
Guides
The 40-Word Rule: How to Write Answer Blocks That AI Extracts
AI models prefer extracting passages of 30-50 words. The 40-word rule, formatting patterns, and content type templates.
April 7, 2026·11 min read
Benchmarks, guides, and calculators for ecommerce founders who want real numbers — not marketing fluff.
347 articles
AI models prefer extracting passages of 30-50 words. The 40-word rule, formatting patterns, and content type templates.

SCUs are 40-80 word blocks that AI models extract verbatim. The anatomy, 5 patterns, and how to write them.

Structure your content so AI search engines extract and cite it. AEO frameworks, formatting rules, and content type rankings.

GEO for content marketers. How to adapt your content strategy for AI citations, the formats that get cited, and measurement.
AI search engines cite content differently than Google ranks it. The content patterns, formatting rules, and structures that earn citations.

Reddit is the most-cited platform in AI search. How indie hackers can use it strategically to build AI visibility.

Build an AI search visibility stack for free. Audit tools, schema generators, citation builders, and monitoring methods.

Test whether ChatGPT, Perplexity, Gemini, Claude, and Copilot recommend your product. Free methods with scoring framework.

Traditional indie hacker SEO tactics are declining. GEO, AI citations, and zero-click commerce are the new growth channels.

Side projects can earn AI citations through comparison pages, Reddit, and structured data. The minimum viable GEO stack.
Solo founders can get ChatGPT mentions without a marketing team. 7 signals that matter, weekly schedule, and the fastest path to AI visibility.
Build AI search visibility with zero budget. Free tools, Reddit strategy, content tactics, and the weekly schedule that works.

Test whether ChatGPT recommends your competitor with these prompt templates. Scoring framework and action plan to close the gap.

Each AI search engine evaluates trust differently. Per-engine signal mapping, entity recognition, and 8-week authority playbook.

SoftwareApplication, Organization, and FAQ schema for SaaS websites. The structured data AI models use to verify and recommend products.

Block training crawlers while allowing AI search bots. Complete AI crawler directory with user-agent strings and recommended rules.

llms.txt tells AI models what your product does. Step-by-step setup guide with field breakdown and platform deployment instructions.

LLMO (Large Language Model Optimization) is the practice of making AI models recommend your SaaS. Scoring framework and tactics.

AI models generate best-X-tools lists millions of times per day. See the signal stack that determines which products get featured.

GEO for SaaS: how to get your product cited by AI search engines. Content strategy, technical setup, and measurement framework.
B2B buyers are using ChatGPT and Perplexity to shortlist software. If your SaaS isn't in the AI answers, you're not on the list.
SaaS products appearing in AI answers are capturing deals before competitors know they exist. Platform-by-platform optimization guide.

AI shopping traffic to retail sites has surged dramatically. What the data shows and 7 steps to capture your share.

The Agentic Commerce Protocol is the open infrastructure for AI-native commerce. What it means for your brand and how to prepare.

Google AI Mode surfaces products differently than traditional search. Optimize your Shopify pages for AI-powered Google results.

AI models skip products with incomplete data. See the 12 attributes that matter most and the data quality checklist.

Set up GA4 to track AI search traffic from ChatGPT, Perplexity, and Google AI Mode. Referrer identification, UTM setup, and custom reports.

Customers are buying inside ChatGPT and Perplexity without visiting your site. How to optimize for zero-click AI shopping.

AI chatbots cite product descriptions with specific attributes, clear structure, and factual claims. See the framework and before/after examples.

15-step GEO checklist for ecommerce stores. Product schema, content structure, off-site authority, and AI visibility measurement.

Early benchmarks show AI search traffic converts significantly higher than organic. See the data, why it happens, and 7 steps to capture it.

DTC brands can appear in AI search results through content authority, structured data, and third-party mentions. No ad spend required.

Submit your product feed to OpenAI for ChatGPT shopping. Shopify auto-enrollment, manual feed submission, and validation steps.

Compare ChatGPT, Perplexity, and Google AI Mode for ecommerce. Traffic, conversion, ranking signals, and where to invest.

ChatGPT weighs source diversity, product data quality, review sentiment, and schema markup. See the ranking factors and how to optimize.

Your product feed has 30+ fields. For AI shopping, about 8 of them matter. See which ones and how to optimize them.

Most brands are invisible to AI. Based on our analysis, we estimate 73% never appear in ChatGPT recommendations. Here's why and how to fix it.

Google's UCP connects merchants to AI shopping across Google AI Mode, Gemini, and third-party agents. What it means for Shopify stores.
Set up your product feed for ChatGPT shopping. Required fields, feed formats, validation errors, and the fields that actually drive recommendations.
The full GEO playbook for ecommerce. 90-day action plan, toolstack, content strategy, and measurement framework.
The content types AI models cite most. Comparison articles, original data, FAQs, and the publishing cadence that builds AI visibility.
Track how often AI models recommend your brand. Manual methods, GEO platforms, and the metrics that actually matter.
Estimated AI search market share across ChatGPT, Perplexity, Google AI Mode, Gemini, and Claude. Platform comparison for ecommerce.
AI search engines cite brands with topical authority. Build content clusters, earn third-party mentions, and compound your AI visibility.
GEO is free and compounds. Google Ads cost $1-5+ per click and stop when you stop paying. Side-by-side comparison with 12-month cost analysis.
Score your store across 10 GEO dimensions. On-site content, schema, off-site authority, and the fixes that move your AI visibility score.

Optimize your Shopify store for voice search and AI assistants. Conversational content, Speakable schema, and FAQ optimization.

Add Product schema to Shopify that AI models actually use. Field-by-field guide with Liquid code examples and validation steps.

80% of products in AI Overviews don't rank in the top 10 organic results. What this means for Shopify merchants and how to adapt.

Yes, you need both SEO and GEO. See where they overlap, where they diverge, and how to allocate effort by business stage.

AI Overviews appear on 14% of shopping queries and 83% of best-X queries. Optimize your Shopify pages to get featured.

Rank your Shopify store in local search results. Google Business Profile, local schema markup, NAP consistency, and local content strategy.

WordPress gives you a higher ceiling, Shopify gives you a higher floor. Side-by-side SEO comparison with cost analysis and recommendations.

7 Shopify SEO apps ranked by actual impact. Most do the same basic things. Only 5 genuinely move the needle.

Build backlinks for your Shopify store with tactics that work in 2026. Product reviews, broken link building, digital PR, and resource pages.

Optimize Shopify product images for Google and AI search. Alt text formulas, file naming conventions, compression targets, and WebP conversion.

Internal linking is the highest-ROI SEO activity for Shopify stores. Hub-and-spoke model, links-per-page benchmarks, and anchor text strategy.

Free keyword research methods for Shopify stores. Google Search Console, autocomplete, competitor analysis, and AI search query mining.

Turn your Shopify blog into an organic traffic engine. Content types that rank, keyword targeting, internal linking, and AI citation strategy.

Optimize Shopify collection pages for search. URL structure, unique descriptions, internal linking, and schema markup for category pages.

Write Shopify product descriptions that rank on Google and convert. Word count benchmarks, keyword placement, and AI-optimized formatting.

Compare Shopify themes by Core Web Vitals, SEO features, and page speed. Dawn, Impulse, and Ride lead the pack.

Migrate to Shopify without losing SEO rankings. URL mapping, 301 redirects, post-launch verification, and common migration mistakes.

Set up Google Search Console for your Shopify store. Verification methods, key reports, weekly audit checklist, and common blind spots.

15 Shopify speed fixes ranked by impact. Remove unused apps, lazy load images, defer JavaScript, and optimize your theme.

Add Product, FAQ, Breadcrumb, and Organization schema to Shopify by editing Liquid directly. No app needed, no monthly fee.

Shopify's default robots.txt blocks important paths. See what's blocked, which AI crawlers to allow, and sitemap optimization tips.

Structure your Shopify store for maximum crawlability. Collections vs tags, URL hierarchy, internal linking, and the 3-click rule.

Shopify creates duplicate URLs for products, collections, and tags. Fix canonical tags, consolidate link equity, and stop diluting rankings.

Fix your Shopify Core Web Vitals with 15 proven optimizations. LCP, CLS, and INP fixes ranked by impact and difficulty.

30-step Shopify SEO checklist covering technical SEO, on-page optimization, content strategy, and AI search readiness. Prioritized by impact.

Get your Shopify products listed in Microsoft Copilot shopping results. Feed submission, schema markup, and Bing Merchant Center setup.

ChatGPT shopping can work for dropshippers but not how most operate. See what AI agents look for and how to build authority fast.

Standard Shopify is enough for AI commerce under $500K. See the feature comparison, cost analysis, and when Plus actually matters.

Score your store across 6 factors to decide if ChatGPT shopping is worth your time. Decision framework with category fit analysis.

Compare Shopify Agentic Storefronts and Amazon Buy with Prime. Data ownership, costs, AI-native vs legacy, and which fits your business.

Shopify reports AI shopping traffic up 9x. Here's what that means for your store and the 7 things to do right now to capture it.

Over a million Shopify merchants have access to ChatGPT shopping. But how many are actually optimized? The real numbers and what they mean.

AI search traffic carries a 30% higher AOV than traditional Google organic. See the data, why it happens, and how to capture it.

AI-referred traffic is up 9x and orders from AI searches are up 14x since January 2025. Platform-by-platform breakdown for ecommerce.

Early data on ChatGPT shopping conversion rates. AI traffic is up 9x with 30% higher AOV. What the numbers mean for your store.

10-step checklist to prepare your store for AI shopping channels. Schema, product data, policies, and the setup most merchants skip.

ChatGPT sends buyers but Shopify doesn't track it cleanly by default. Set up referral tracking, UTMs, and GA4 to see your AI commerce revenue.

ChatGPT shopping is organic and free. Amazon charges 15%+ fees. Compare conversion rates, costs, and which channel fits your business.

Google AI Mode is changing how shoppers find products. Set up your Shopify store to appear in AI-powered Google search results.

Perplexity shopping returns 3-5 curated product cards per query. Optimize your Shopify data to appear in those recommendations.

Yes, product images affect AI recommendations through metadata. Alt text, file names, schema, and image specs that AI shopping agents actually read.

AI shopping agents pull FAQ content to answer buyer questions. See real examples of good vs bad FAQs and the categories that drive purchases.

The 12 Shopify metafields that AI shopping agents read. Namespace/key examples, setup steps, and which fields have the highest impact.

AI models parse product descriptions differently than humans. See the framework, before/after examples, and the attributes ChatGPT extracts.

Product titles are the #1 signal ChatGPT uses for discovery. See the formula, good vs bad examples, and category-specific templates.

Shopify's Agentic Plan lets non-Shopify brands list products in AI shopping channels. No monthly fee, no migration required. Here's how it works.

Map your Shopify product data correctly for AI commerce channels. Metafields, attributes, and catalog mapping that ChatGPT and Perplexity actually use.

Shop Pay is required for ChatGPT in-app purchases. Here's how to enable it, verify eligibility, and optimize for AI checkout conversions.

Set up Shopify's Knowledge Base app to control how AI agents describe your brand and answer customer questions. Step-by-step with FAQ examples.

Step-by-step setup guide for Shopify Agentic Storefronts. Get your products discoverable in ChatGPT, Perplexity, Google AI Mode, and Microsoft Copilot.
Compare the 9 best AI tools for Etsy sellers in 2026. Real pricing from $3.99 to $49.99/month, with features for SEO, listing optimization, product research, an
Shopify merchants spend $120/month on apps on average, with 87% using apps and the average store running 6. See cost breakdowns by category and store size.
The average ecommerce return rate is 20-24.5%. See 2026 refund rate benchmarks by product category, the true cost of returns, and how to reduce them.
How to use AI to write Amazon product listings that rank in search and convert browsers into buyers. Tools, A10 algorithm tips, and Rufus optimization included.
Run multiple ecommerce stores with AI tools for inventory sync, cross-store pricing, unified customer support, and automated marketing. Real tool recommendation
Generate product schema markup with AI for rich snippets in Google and AI search. JSON-LD templates, validation tools, and the properties that actually drive cl
Use AI and machine learning to predict customer lifetime value with 85%+ accuracy. RFM analysis, model selection, and practical implementation for ecommerce.
AI loyalty programs increase retention by personalizing rewards based on customer behavior. Compare Smile.io, Yotpo, LoyaltyLion pricing, features, and real res
Klaviyo's AI generates email flows from natural language prompts. Here's how to build welcome, cart recovery, and post-purchase flows with AI on Shopify.
AI tax tools automate sales tax across 11,000+ jurisdictions. See how TaxJar, Avalara, and newer AI tools handle nexus, filing, and compliance for ecommerce sel
How to use AI for ecommerce social media management and content creation. Tools, workflows, pricing, and the posting strategies that actually drive revenue.
Automated email flows generate 41% of email revenue from just 2% of sends. See how AI transforms welcome, cart recovery, and post-purchase flows.

How to use AI for ecommerce conversion rate optimization. Benchmarks by industry, AI-powered CRO tools, and strategies that move the needle on real revenue.
Which AI ecommerce tools actually work in 2026 and which are still hype? 96% of ecommerce pros use AI, but only 33% have fully implemented it. See what's produc
Build AI-powered win-back campaigns that re-engage lapsed ecommerce customers. Timing triggers, email sequences, predictive churn scoring, and real benchmarks.
33% of shoppers abandon carts when shown USD-only pricing. AI translation and localization tools cut cross-border friction. See tools, costs, and ROI.
AI chatbot vs live chat for ecommerce: which converts better and costs less? Side-by-side comparison of conversion rates, pricing, and resolution data for 2026.
Ecommerce vs Amazon FBA vs dropshipping income compared. Real profit margins, startup costs, and earning potential.
How to make $10K per month with ecommerce. The exact math, business model, margins, and ad spend needed.
Realistic ecommerce income by stage. What founders actually earn at $5K, $25K, $100K, and $500K+ monthly revenue.
How much do Shopify store owners actually make? Real income data by store size, niche, and experience level.
Find your target audience before spending on ads. Customer research methods, buyer persona frameworks, and audience validation.
High ticket dropshipping explained: how it works, real profit margins, supplier sourcing, and why $500+ products change everything.
Write product descriptions that convert browsers into buyers. Formulas, real examples, and ecommerce copy psychology.
The best Shopify themes for conversion in 2026. Speed benchmarks, mobile performance, and which themes move the needle on sales.
The best AI SEO tools for Shopify in 2026. Free and paid options for product pages, blog content, and technical SEO.
How to use AI tools for ecommerce keyword research. Find buyer-intent keywords, cluster topics, and build content plans.
Does AI-written blog content actually rank for ecommerce sites? Real data on AI content performance and the workflows that work.
AI tools that reveal why customers buy and why they don't. Review mining, survey analysis, and customer research workflows.

How to use AI for sentiment analysis on product reviews. Tools, workflows, and practical applications for ecommerce brands.
The best AI tools for TikTok ad creation in 2026. Scripting, video generation, voiceover, editing, and all-in-one platforms.
Step-by-step guide to making TikTok ads with AI. Scripting, creative generation, hooks, editing, and cost breakdowns.
Use AI to analyze competitor Facebook ads. Pull ads from Meta Ad Library, feed them to ChatGPT, and extract strategies.
Use AI to scale Facebook ads without tanking your ROAS. Creative refresh automation, budget pacing, and audience expansion.
Use ChatGPT to write Facebook ad copy. 6 copy-paste prompt templates for hooks, primary text, headlines, and carousel ads.
Use AI for Facebook ad targeting and audience research. Build lookalikes, mine review data, and find hidden segments.
Use AI to create Facebook ads that actually convert. Step-by-step workflow for ad copy, creative, targeting, and testing.
Practical guide to using AI to reduce cart abandonment. Recovery emails, exit-intent popups, chatbots, and checkout optimization.
How to use AI for ecommerce personalization across product recommendations, email, and on-site experiences. Tools, tactics, and ROI benchmarks.
How to use AI to optimize your product pages for conversions. AI-powered copy testing, image optimization, pricing, and personalization.
How to write AI product descriptions that convert. Prompt engineering, editing frameworks, common mistakes, and before/after examples.
Step-by-step guide to building a Shopify store with AI in under 24 hours. Store setup, product descriptions, images, pricing, and launch checklist.
The 10 best AI tools for dropshipping product research in 2026. Find winning products, validate demand, and check margins before you list.
How to use AI tools for ecommerce competitor analysis. Track pricing, ads, products, and strategy changes automatically.
Exact prompts and workflows for using ChatGPT to find profitable Amazon products. Niche analysis, competitor research, and demand validation.
A step-by-step process for validating ecommerce product ideas using AI tools. Estimate demand, test pricing, analyze competitors, and de-risk your launch.
The 12 best AI product research tools for ecommerce in 2026. Real pricing, features, and honest takes on which tools actually help you find winning products.
AI tools can analyze reviews, predict trends, and validate products before you spend a dollar. The complete AI product research workflow for dropshippers.
The Shopify Knowledge Base app lets you control how AI agents describe and sell your products. How to set it up and why it matters.
Shopify charges 4% on agentic commerce transactions. Whether the fee is worth it depends on your margins and how much AI-driven traffic you get.
ChatGPT Shopping is a new product discovery channel. How to optimize your Shopify store so ChatGPT recommends your products.
Google AI Mode is reshaping product discovery. How to get your products surfaced in AI-generated shopping results.
Agentic storefronts and traditional SEO target completely different discovery paths. Where to invest your time and budget in 2026.
Agentic storefronts let AI agents browse, evaluate, and buy from your Shopify store on behalf of users. How they work and what to build now.
ChatGPT Shopping and Google Shopping work completely differently. How each platform discovers and recommends products, and how to win on both.
Schema markup is how AI models understand your content well enough to cite it. Which schema types matter and how to implement them on Shopify.
YouTube accounts for 39.2% of all AI-generated references. How to optimize video content so AI systems cite your brand.
Reddit is the single most cited domain across ChatGPT, Perplexity, and Google AI Overviews. Why Reddit posts dominate AI citations and how to build a presence for GEO.
Actionable guide to getting your products recommended when someone asks AI for the best option. Covers product-level structured data, review aggregation, and citation triggers.
Perplexity AI sources answers differently from ChatGPT. How to get your Shopify store cited in Perplexity search results with structured data, reviews, and content strategy.
B2B buyers are using ChatGPT and Perplexity to evaluate and shortlist software. If your SaaS isn't optimized for AI recommendations, you're invisible to a growing segment.
Agentic commerce lets AI agents browse, evaluate, and purchase products on behalf of users. What it means, how Shopify is building for it, and what merchants need to do now.
You don't need a marketing team or big budget to get mentioned by ChatGPT. A step-by-step playbook for building AI visibility from scratch.
Only 1.6% of AI-cited URLs come from paid ads. Why paid placement doesn't work in AI search and what actually drives ChatGPT recommendations.
ChatGPT Shopping and Google Shopping work completely differently. How each platform discovers and recommends products, where to invest, and how to win on both.
Most Shopify stores are completely invisible to ChatGPT, Perplexity, and Gemini. The common reasons AI skips your store and the exact fixes to start getting recommended.
The 7 concrete signals AI systems like ChatGPT, Perplexity, and Gemini use to decide whether to recommend your Shopify store. How to optimize each one.
Google rankings and AI citations are driven by completely different signals. Only 12% of AI-cited URLs rank in Google's top 10. Here's why and what it means for your store.
The actual mechanisms ChatGPT uses to decide which products to recommend, from training data and web presence to reviews, structured data, and brand mentions.
GEO is the practice of optimizing your brand to be recommended by AI systems like ChatGPT, Perplexity, and Gemini. This complete guide covers how GEO works, how it differs from SEO, and how to start.
Reverse-engineering how ChatGPT, Perplexity, Gemini, and Claude decide which products to recommend when asked.
Step-by-step guide to generating static ad images with AI. Tools, workflows, prompt templates, and cost comparison vs hiring a designer.
DTC brands have a structural advantage in AI search: direct customer relationships, owned content, and brand story. Here's how to leverage it.
AI video tools start at $8/month vs $1,500+ for traditional production. Here's how to create product demos, UGC-style, and spokesperson videos.
Which schema types matter for AI citation, how to implement them on Shopify, and which AI models actually use structured data.
9 AI ad generators compared: AdCreative.ai, Predis, Pencil, Canva AI, Midjourney, ChatGPT, Advantage+, Creatopy, and Bannerbear.
Score your store across 19 checkpoints in 4 categories: technical, content, off-site, and brand. Free audit framework with scoring rubric.
AI at every step: niche selection, product research, store building, ad creative, customer service, and scaling. The complete workflow.
YouTube is the #1 source for AI citations, especially Gemini. Here's how to optimize video content for AI search visibility.
AI tools can generate professional product photos, lifestyle scenes, and model shots for free. Here's how to do it and when it works.
Reddit is disproportionately cited by ChatGPT, Perplexity, and Gemini. Here's why and how to build a Reddit presence for AI visibility.
AI can handle audience research, ad copy, creative generation, and bid optimization. Here's the full workflow with specific tools.
When someone asks ChatGPT 'what's the best X for Y,' your product should be the answer. Here's how to make that happen.
AI tools can analyze reviews, predict trends, and validate products before you spend a dollar. Here's the complete AI product research workflow.
Perplexity is the fastest-growing AI search engine and it sources answers differently from ChatGPT. Here's how to get your Shopify store cited.
Run a free AI visibility audit in 5 minutes. See your score, spot red flags, and get an action plan.
AI recommends your competitors by name. Find out who's showing up instead of you and how to close the gap.
Your AI visibility score is 0-100. Here's what each range means, what affects it, and how to improve it.
Mistral is the leading AI in Europe. If you sell internationally, you need to show up in Le Chat.
Meta AI is embedded in Instagram, WhatsApp, and Facebook. 3B+ users. Is your brand visible to it?
Grok pulls from X/Twitter in real-time. Your social presence directly affects whether it recommends you.
Claude is cautious about product recommendations. Here's what it takes to earn one and how to test.
Gemini powers Google AI Overviews. If you're not in them, you're losing clicks. Here's how to check.
Perplexity searches the web in real-time and cites sources. Find out if your brand is one of them.
Does ChatGPT recommend your brand when customers ask? How to test manually and what to do if you're not showing up.
Scan your brand across ChatGPT, Gemini, Perplexity, Claude, and more. Free AI visibility score in 60 seconds.
Whitelisted ads run from the influencer's handle but with your targeting and budget. See setup steps for Meta, TikTok, and the contract terms you need.
Usage rights, exclusivity windows, FTC compliance, and kill clauses. See the 12 contract terms that protect your brand — with copy-paste language.
UTM links, promo codes, and affiliate dashboards — see the 3 attribution methods, how to set each up, and which one actually gives you accurate data.
Cold DMs get 2-5% reply rates. These templates get 20-30%. See the exact messages, subject lines, and follow-up sequences for Instagram, TikTok, and email.
Standard influencer commissions range from 10-25% of sales. See commission structures by tier, platform, and niche — plus hybrid deals that protect your margins.
Most influencers inflate rates by 2-3x. See the exact scripts, counter-offer templates, and negotiation tactics that get you 40-60% off the initial ask.
Skip the agencies. Find influencers manually using hashtag search, competitor tags, and creator marketplaces. Step-by-step process with free tools.
Affiliates get paid per sale (low risk). Influencers get paid per post (high reach). See the pros, cons, cost structures, and which drives more profitable growth.
UGC is content you own and run as ads. Influencer marketing is reach you rent. See cost comparison, performance data, and when to use each for ecommerce.
Micro-influencers (10K-100K) get 3-5x higher engagement but macro-influencers drive more total volume. See cost per conversion, engagement rates, and when to use each.
The average influencer marketing ROI is $5.78 for every $1 spent. See 2026 benchmarks by platform, niche, and influencer tier — plus how to measure yours.
Instagram nano-influencers charge $100-$500 per post. TikTok creators charge $200-$1,000. See 2026 rate benchmarks by platform, follower tier, and content type.
A good ROAS for ecommerce is 3x-4x. But the real number depends on your margins. See benchmarks by industry, ad platform, and business model.
The average Facebook Ads ROAS is 2.19x across all industries. See 2026 benchmarks for ecommerce, beauty, apparel, supplements, home goods, and more.
The average ecommerce conversion rate is 2.5-3%. See 2026 benchmarks by industry, device, traffic source, and platform — plus how top stores hit 5%+.
A good ecommerce profit margin is 60-70% gross and 10-20% net. See 2026 benchmarks by niche, business model, and brand size.
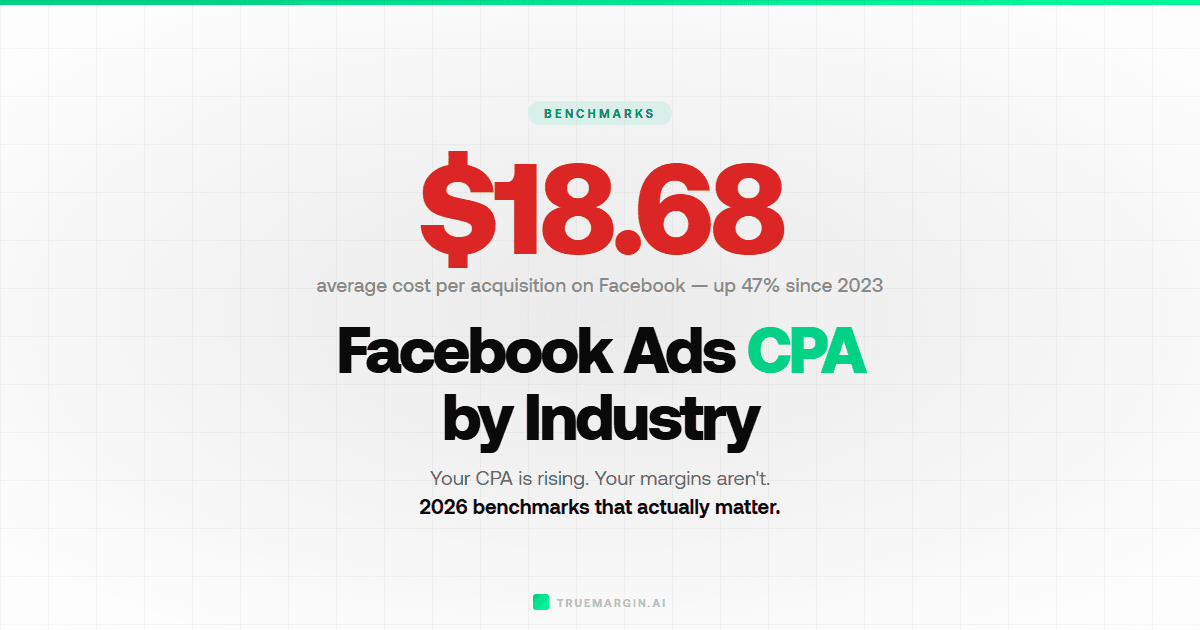
The average CPA for Facebook Ads is $38 across all industries. See 2026 benchmarks by ecommerce niche, plus how to calculate your target CPA.
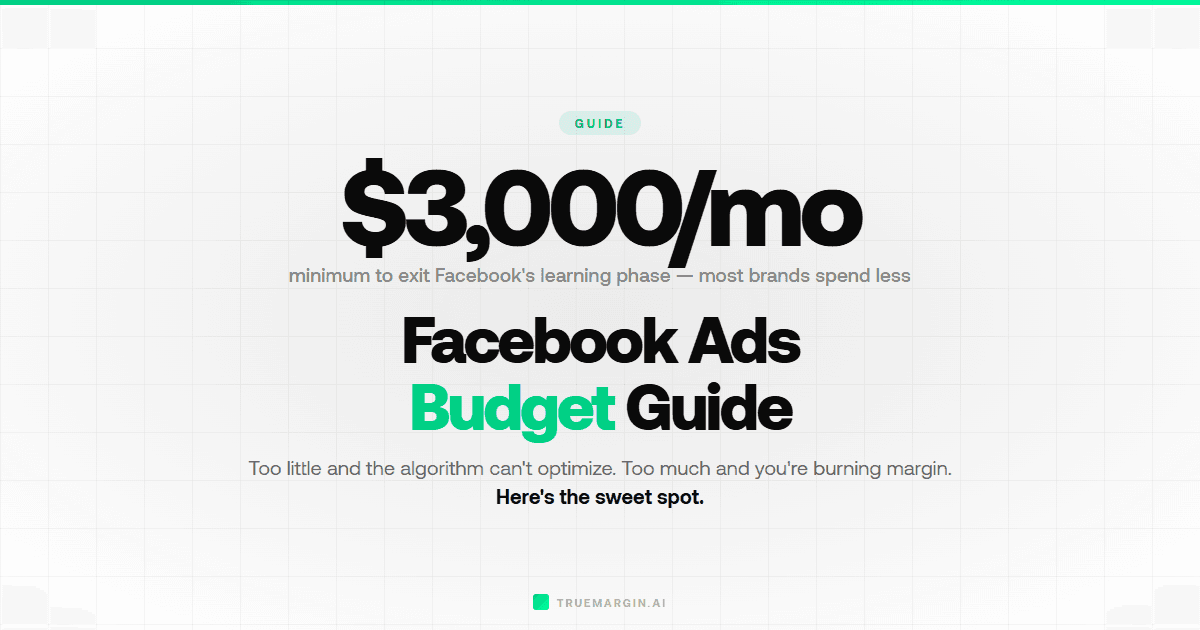
Most ecommerce brands should spend 5-12% of revenue on Facebook Ads. See exact budgets by business stage and the formula to calculate your ideal spend.
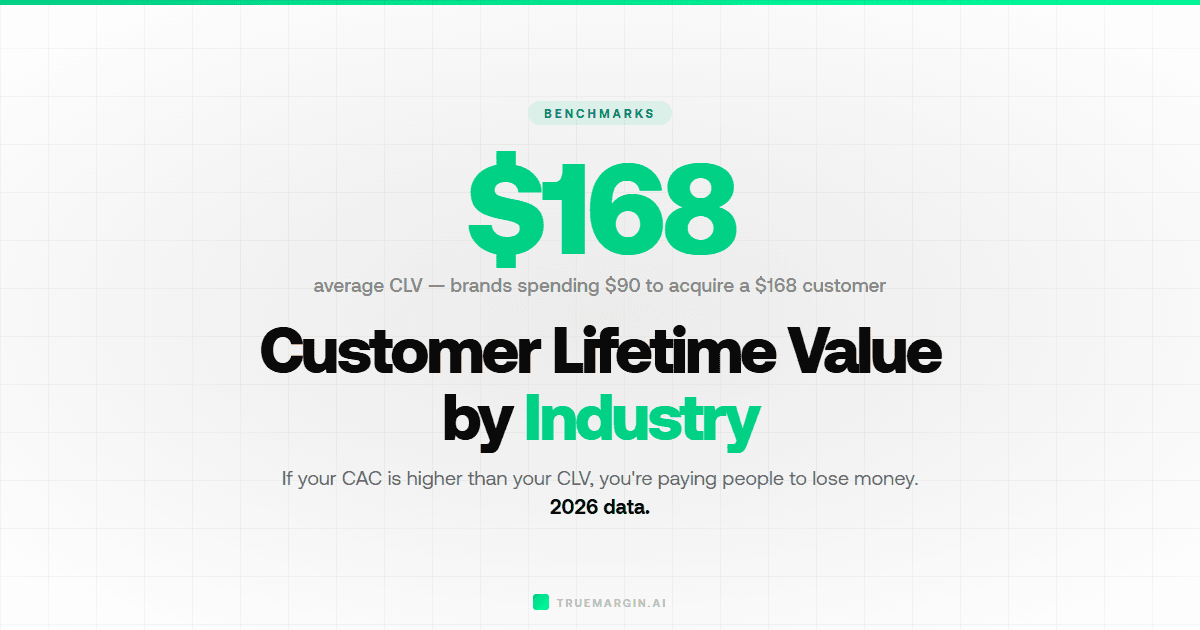
The average customer lifetime value in ecommerce is $150-$300. See 2026 LTV benchmarks by industry and business model.
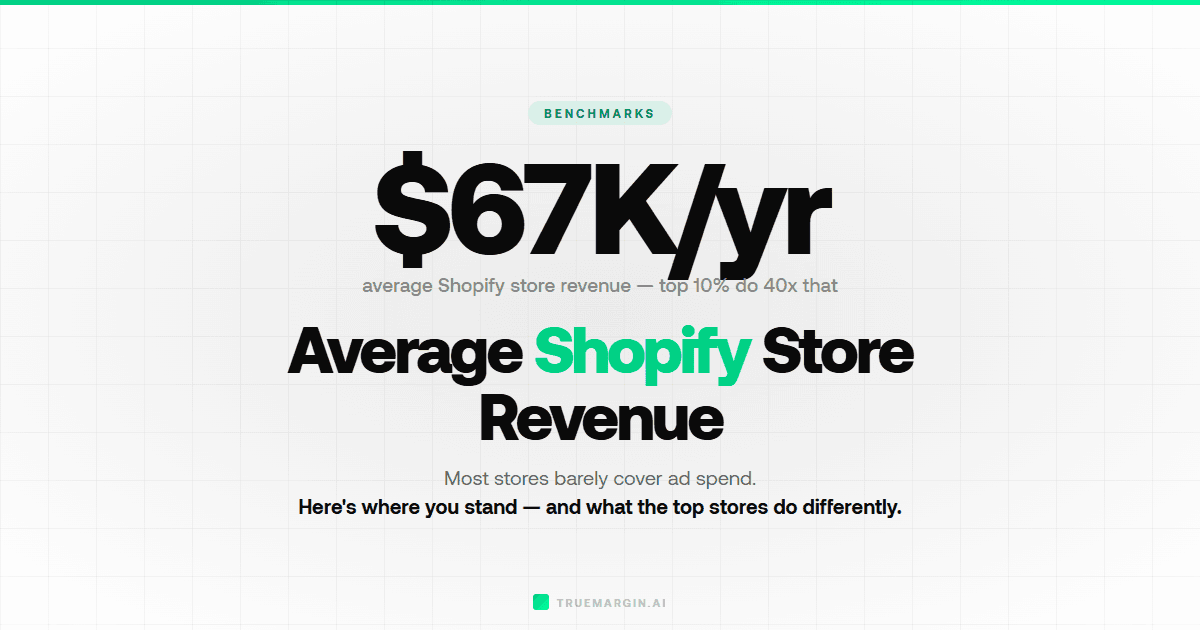
The average Shopify store makes $150K per year, but the median is closer to $19K. See 2026 benchmarks by niche, store age, and tier.
The average ecommerce order value is $147 globally. See 2026 AOV benchmarks by industry, platform, and device — plus 7 strategies to increase yours.
The average Google Ads ROAS for ecommerce is 3.68x. See 2026 benchmarks by campaign type, industry, and how Google compares to Facebook Ads.
The average ecommerce return rate is 20-30%. See 2026 benchmarks by industry and product category — plus how returns destroy profit margins.
The average cart abandonment rate is 70.19%. See 2026 benchmarks by industry and device, top reasons shoppers abandon carts, and strategies to recover lost revenue.
The average TikTok Ads ROAS is 1.7x across all industries. See 2026 benchmarks by niche, CPC/CPM/CPA data, and how TikTok compares to Facebook Ads.
A good CPA for ecommerce is $30-$50, but the right number depends on your margins. See 2026 CPA benchmarks by niche and platform, plus 6 ways to lower acquisition costs.
Ecommerce profit margins by industry range from 15% gross in electronics to 70%+ in beauty. See 2026 benchmarks for 15+ industries and business models.
Gross Margin = (Revenue - COGS) / Revenue x 100. See gross vs net vs contribution margin, worked examples, and margins by industry.
ROAS = Revenue from Ads / Cost of Ads. See worked examples, ROAS vs ROI, breakeven ROAS by margin, and ROAS benchmarks by platform.
Breakeven ROAS = 1 / Gross Profit Margin. See worked examples at 30%, 50%, and 70% margins, plus the hidden costs most founders forget.
LTV = Average Order Value x Purchase Frequency x Customer Lifespan. See the LTV:CAC ratio, worked examples, and how to increase LTV.
CPA = Total Ad Spend / Number of Conversions. See the CPA vs CAC difference, target CPA formula, and CPA benchmarks by platform.
Price your product at 3-5x your total landed cost. See cost-plus vs value-based pricing, worked examples, and pricing by niche.
Ad Budget = Target Revenue / Expected ROAS. See three formulas, budget by business stage, platform allocation, and minimum viable ad budget.
Markup = (Selling Price - Cost) / Cost x 100. See the full conversion table, why 50% margin is not 50% markup, and recommended markups by industry.
CAC = Total Sales and Marketing Costs / New Customers. See the difference between CAC and CPA, LTV:CAC ratios, and how to reduce acquisition costs.
Shipping cost per order = carrier rate + packaging + handling + insurance. See carrier comparisons, DIM weight explained, and the free shipping threshold formula.
Revenue ≠ profit. True Profit = Revenue - COGS - Shipping - Ad Spend - Fees - Returns. See full P&L breakdowns at $30, $55, and $120 price points.
Conversion Rate = Conversions / Visitors × 100. See benchmarks by industry, traffic source, and device — plus 7 ways to improve yours.
Gross margin = Revenue minus COGS. Net margin = Revenue minus everything. See why a 60% gross margin can still mean 5% net — with full waterfall examples.
COGS = Beginning Inventory + Purchases - Ending Inventory. See what counts as COGS, what doesn't, benchmarks by industry, and why most founders undercount it.
Influencer ROI = (Revenue - Cost) / Cost × 100. See cost by tier, CPM vs paid ads, attribution methods, and when influencer marketing beats Facebook Ads.
50% markup ≠ 50% margin. Markup is profit over cost, margin is profit over price. See the conversion table, formulas, and why confusing them costs you thousands.
ROAS measures ad efficiency. ROI measures actual profit. A 4x ROAS can mean negative ROI. See both formulas, worked examples, and when to use each.
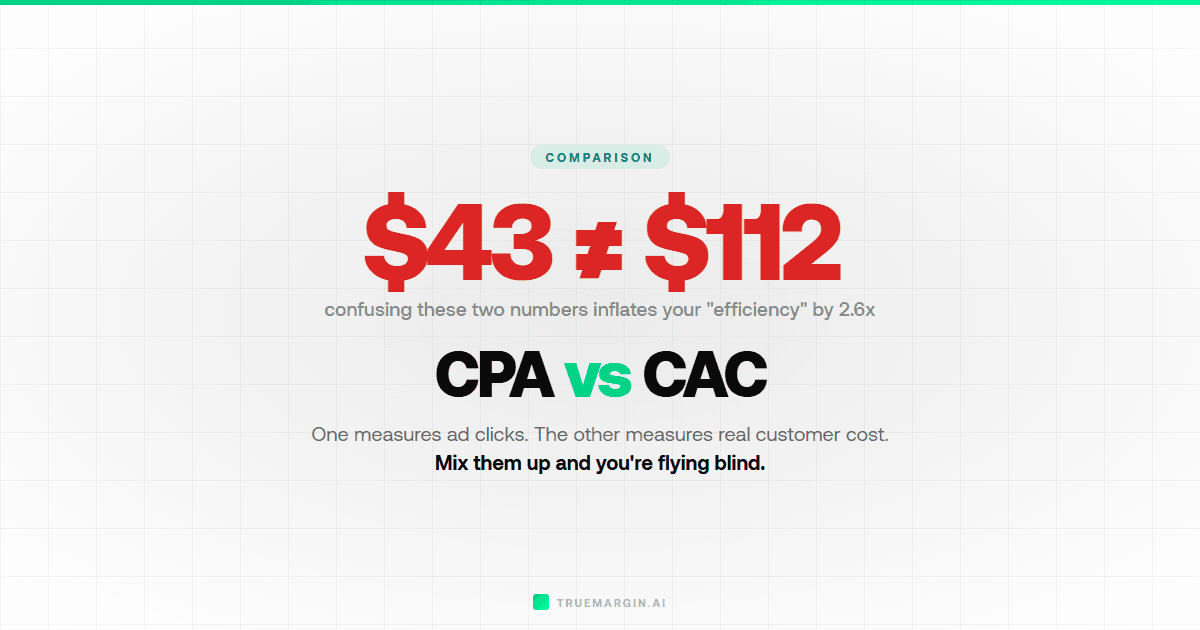
CPA = ad spend per conversion. CAC = total cost per new customer. A $30 CPA often means a $75 CAC. See the full breakdown and why most founders confuse them.
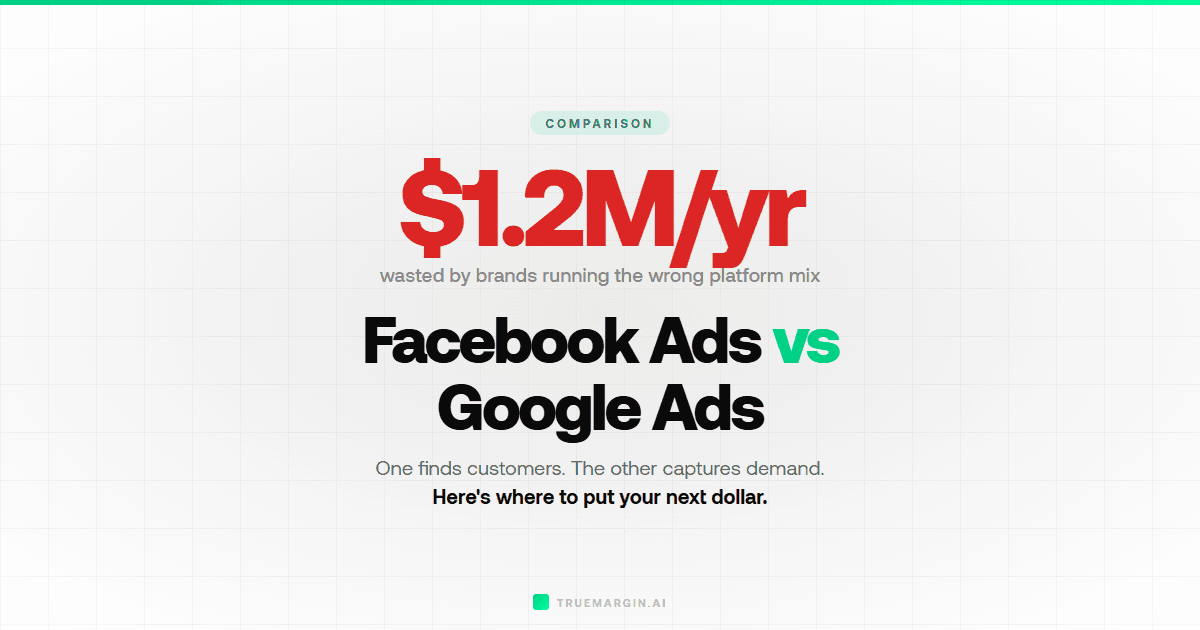
Use both — but allocate differently. Facebook creates demand, Google captures it. See ROAS, CPC, and CPA side by side plus budget allocation by business stage.
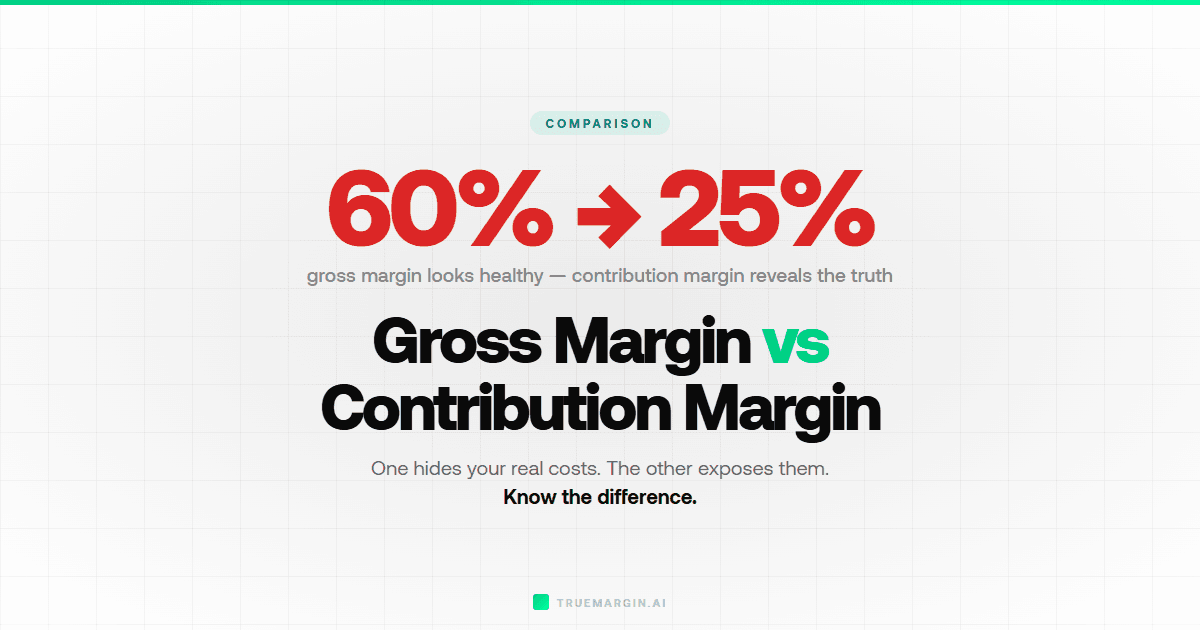
Gross margin subtracts COGS. Contribution margin subtracts ALL variable costs. See why a 65% gross margin can mean only 15% contribution margin — and which metric actually matters.
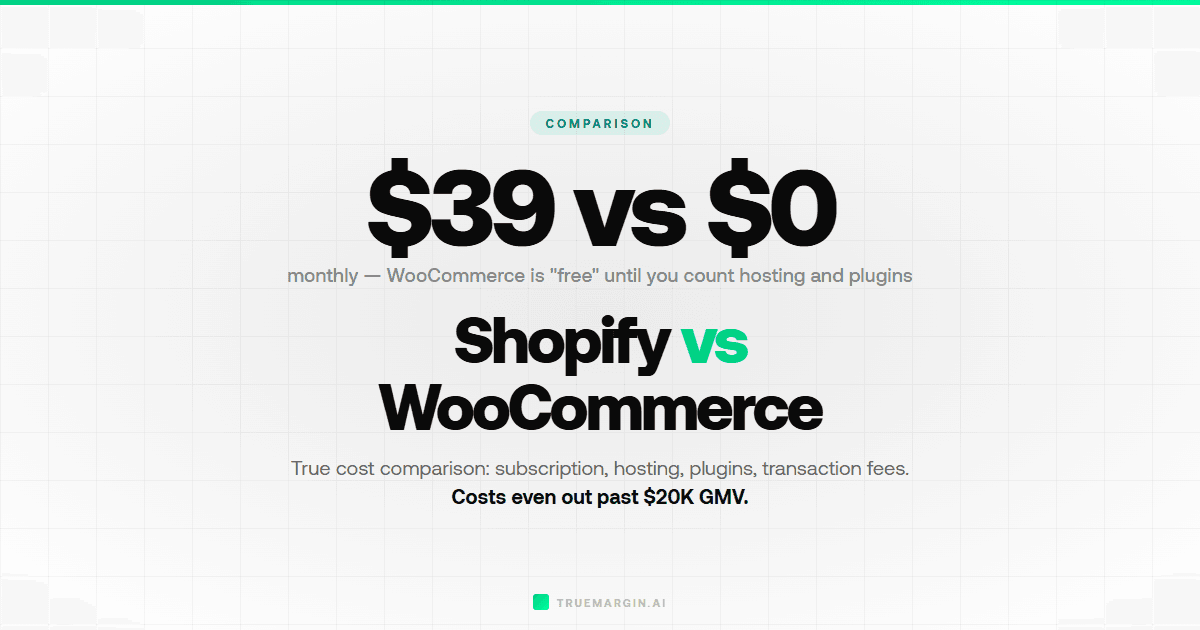
Shopify: $39-$399/month all-in. WooCommerce: free plugin but $75-$6,550/year in hosting and plugins. Total costs even out past $20K GMV.
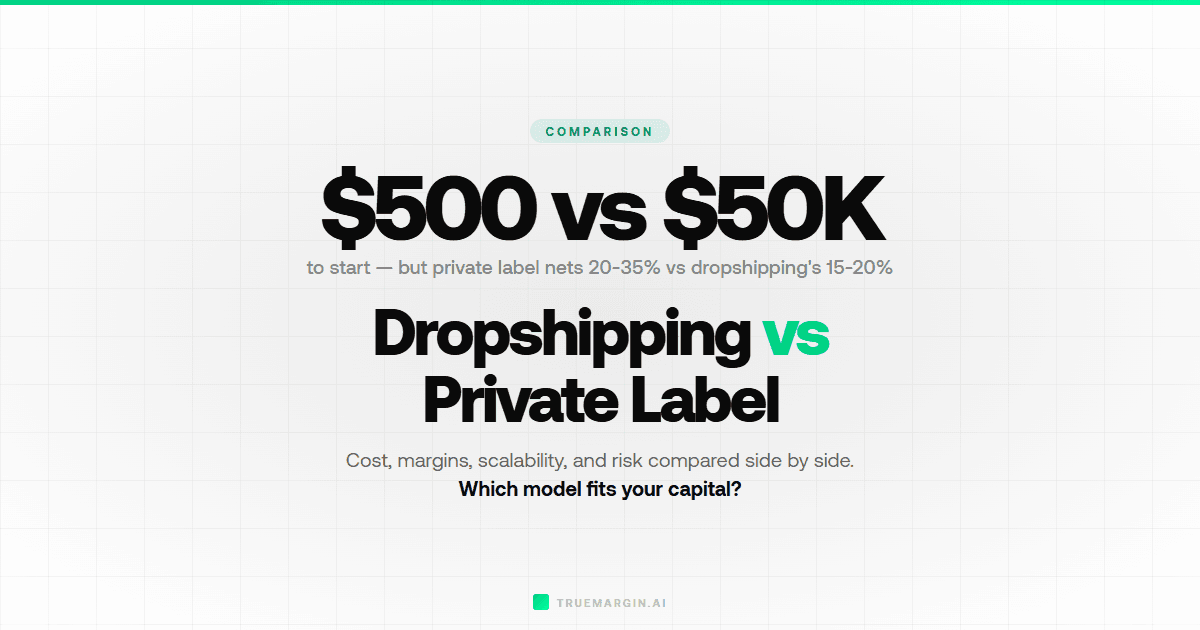
Dropshipping: 15-20% net margins, $500 to start. Private label: 20-35% net margins, $5K-$50K to start. See the full cost and scalability comparison.
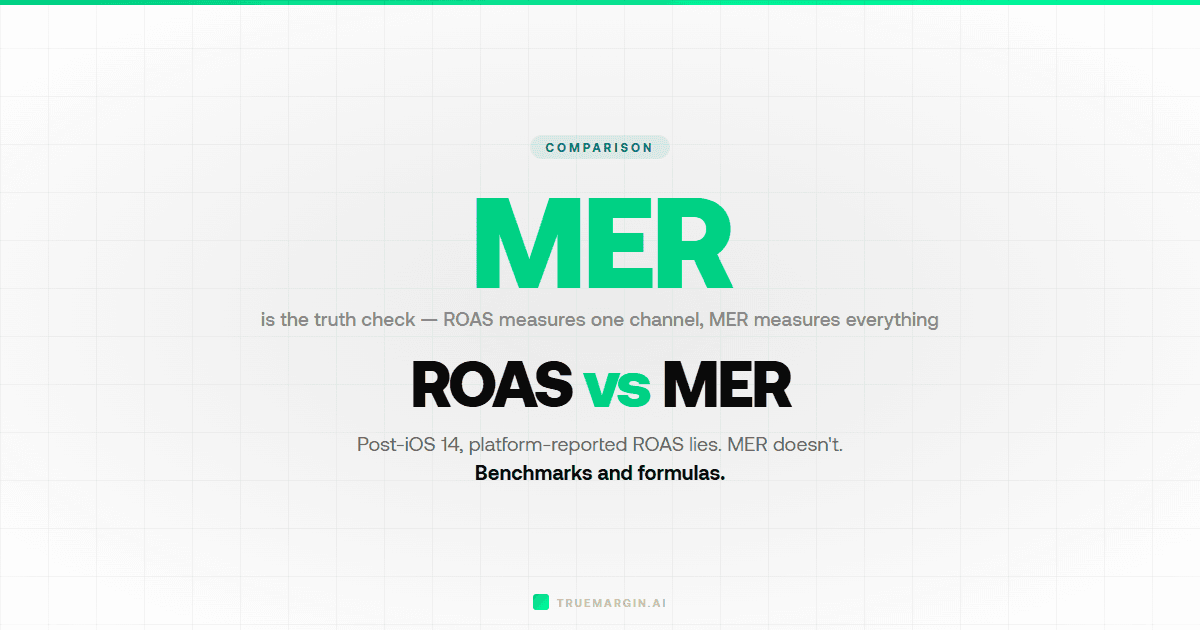
ROAS measures one channel. MER measures all marketing spend vs total revenue. Post-iOS 14, MER is the truth check. See benchmarks and formulas.
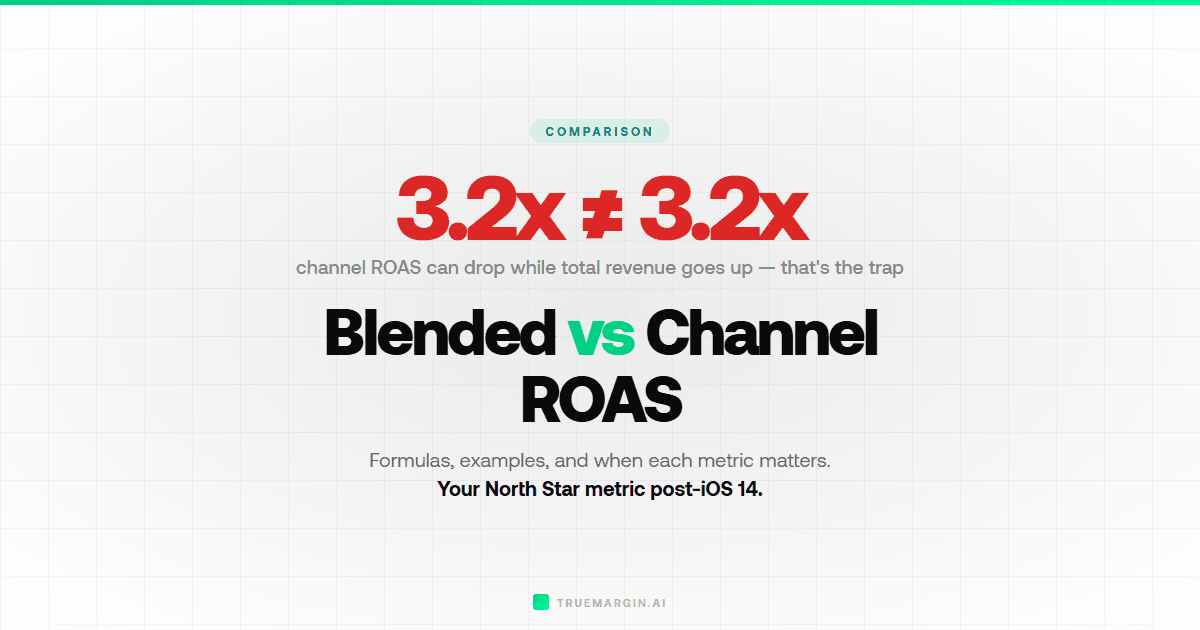
Channel ROAS can drop while total revenue increases. Blended ROAS is your North Star metric. See formulas, examples, and when each matters.
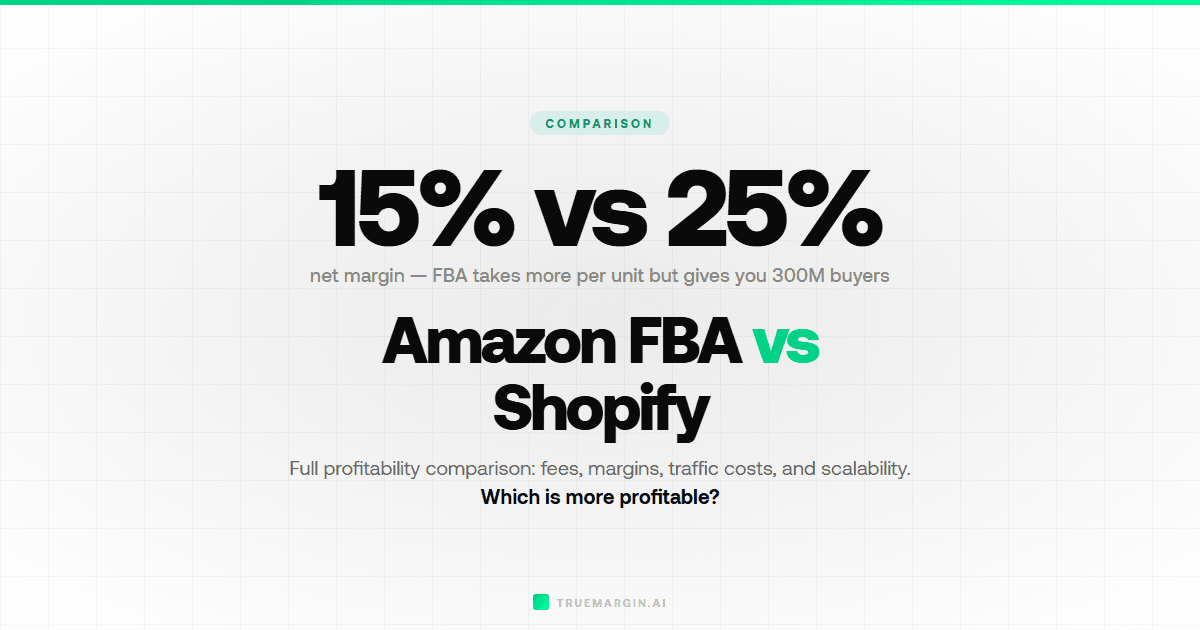
FBA takes 15-20% in fees but gives you 300M+ buyers. Shopify keeps more per unit but you drive your own traffic. See the full profitability comparison.
Revenue is a vanity metric. A store doing $100K/month can lose money. See the 6 mistakes founders make and how to track what actually matters.
Meta averages 4.2x ROAS, TikTok averages 2.8x. TikTok CPM is half of Meta's. See CPC, CPM, CPA, and ROAS side by side with strategic recommendations.
Gross margins average 60-75%, but net margins are 15-20% after ads, fees, and returns. See margins by product category and how to improve yours.
Start with $100-$200/day, use ABO for testing and CBO for scaling. Full-funnel campaign structure, key metrics, and the 5 mistakes that kill ROAS.
If you can't make money on one customer, scaling to a million won't fix it. See the key metrics (CAC, LTV, contribution margin) with benchmarks.
Scale after 5-7 days of stable ROAS with 50+ conversions. Increase budgets 20-25% every 48-72 hours. Kill ads when frequency hits 3-4 and CTR drops.
A Basic plan user commonly spends more on apps than the Shopify subscription. See the full fee breakdown by plan tier with real-world cost examples.
73% of DTC brands fail scaling from $10M to $50M. Real costs are 30-40% higher than founders expect. See the true cost structure and margin math.
Product alone doesn't sell — the offer does. See offer stacking, bonus structures, urgency triggers, and the 5-part framework that turns browsers into buyers.
Free shipping increases conversion by 20-30% but eats margins if you set the threshold wrong. See the formula, real examples, and 4 strategies that protect profit.
The average ecommerce CAC is $45-$75. See 10 tactics to lower it — from creative testing to lookalike audiences to organic content funnels.
Upsells, bundles, and free shipping thresholds can increase AOV by 10-30%. See 8 proven strategies with real examples and expected revenue impact.
The average ecommerce conversion rate is 2.5-3%. See 12 proven tactics to push yours above 4% — from page speed to trust signals to checkout optimization.
Kill ads with CTR below 1%, CPA 2x your target, or frequency above 3-4. See the exact decision framework and the 5 metrics that tell you when to cut.
CPM, CTR, CPC, CPA, ROAS — what each metric means, what good looks like, and which ones actually matter for ecommerce profitability.
The average cart abandonment rate is 70%. See the top 10 causes and proven recovery tactics — from exit-intent popups to abandoned cart email sequences.
Profitable stores go broke from cash flow gaps. See the cash conversion cycle, inventory timing, and how to forecast cash flow for seasonal businesses.
20% of your SKUs generate 80% of your profit. See how to calculate per-SKU margins, set up tracking, and identify which products to cut or scale.
VAT registration is mandatory once you hit threshold in EU, UK, or Australia. See thresholds by country, how to register, and how VAT affects your margins.
Mark up dropshipping products 2.5-3x your total landed cost. See pricing formulas by category, competitor pricing strategies, and common pricing mistakes.
Most ecommerce founders track revenue but not profit. See a real P&L template, line-by-line breakdown, and the 5 line items that kill margins.
Use TikTok Creative Center, Amazon Movers & Shakers, and Google Trends to find products before they peak. See the 7-step validation framework.
Google Shopping ROAS averages 4-6x for ecommerce. See feed optimization, bidding strategies, Performance Max setup, and how to structure campaigns for profit.
Email delivers $36-$42 for every $1 spent — the highest ROI of any marketing channel. See benchmarks by flow type, open rates, and how to measure yours.
Spend 5-12% of revenue on marketing in growth phase, 3-5% at scale. See budget allocation by channel, stage, and the formula to calculate your number.
TikTok Shop takes 5% commission plus payment processing. See the full fee structure, affiliate commissions, shipping subsidies, and how it compares to Shopify.
FBA fees eat 30-40% of your selling price. Referral fees, fulfillment fees, storage fees, and hidden charges — see the full breakdown with real product examples.
Walmart charges 6-15% referral fees with no monthly subscription. See the full fee breakdown, WFS fulfillment costs, and how Walmart compares to Amazon FBA.
Pet supplements hit 70%+ gross margins. Custom jewelry averages 65%. See the 10 most profitable niches with margin data, competition levels, and startup costs.
Cost-plus, value-based, charm pricing, bundle pricing, and more. See which strategies work for which business models — with real margin impact examples.
GEO (Generative Engine Optimization) is how you get your store recommended by ChatGPT, Perplexity, and Gemini. Here's what it is and why it matters now.
Shopify's ChatGPT integration lets AI recommend your products directly in conversation. Here's how to position your store to be the one it picks.
Actionable steps to get your Shopify store cited by AI systems. YouTube, Reddit, structured data, and brand authority — the full GEO playbook.
88% of URLs cited by AI systems don't rank in Google's top 10. GEO targets the AI layer that SEO misses. Here's how they compare and why you need both.
Your AI visibility score measures how likely ChatGPT, Perplexity, and Gemini are to recommend your store. Here's how it works and how to check yours.
Cut COGS, reduce CAC, increase AOV, lower shipping costs, and eliminate waste — 5 proven ways to boost profit margins without touching your prices.
Returns, chargebacks, rising CAC, shipping surcharges, app fee creep, and currency conversion — the 6 hidden costs that silently kill ecommerce margins.
The best free tools for ecommerce founders — from profit calculators to analytics, email, SEO, and design. All with real free tiers, no bait-and-switch.
ROAS is the revenue generated for every dollar spent on ads. See the formula, good ROAS benchmarks by platform, and when ROAS is misleading.
CPA (Cost Per Acquisition) is how much you spend to acquire one paying customer. See the formula, benchmarks by industry and platform, and how to lower yours.
LTV is the total revenue a customer generates over their relationship with your brand. See the formula, benchmarks, and the LTV:CAC ratio that matters.
Contribution margin is revenue minus variable costs. See the formula, how it differs from gross margin, benchmarks by industry, and how to improve yours.
Breakeven ROAS is the minimum return on ad spend to cover your costs. See the formula (1 / margin), worked examples, and a margin-to-breakeven table.
MER is total revenue divided by total marketing spend. See the formula, how it differs from ROAS, and what a good MER looks like for ecommerce.
AOV is the average dollar amount a customer spends per transaction. See the formula, benchmarks by industry, and 6 proven tactics to increase yours.
COGS is the direct cost of producing the products you sell. See what's included, the formula, examples by business model, and how to reduce yours.
An ecommerce sales funnel maps the journey from awareness to purchase. See the 4 stages, conversion rates at each, and how to build yours.
Dynamic pricing adjusts prices in real time based on demand, competition, and customer behavior. See types, examples, pros/cons, and how to implement.
A good LTV:CAC ratio for ecommerce is 3:1. See what each ratio tier means, benchmarks by industry, and how to improve yours.
A good ROAS for fashion brands is 4x-6x. See benchmarks by sub-category (luxury, fast fashion, athleisure) and by platform (Meta, Google, TikTok).
A good ROAS for supplement brands is 2.5x-4x on first order. See benchmarks by type, platform, and how subscriptions change the math.
A good ROAS for beauty brands is 3x-5x. See benchmarks by sub-category (skincare, makeup, haircare, fragrance) and platform.
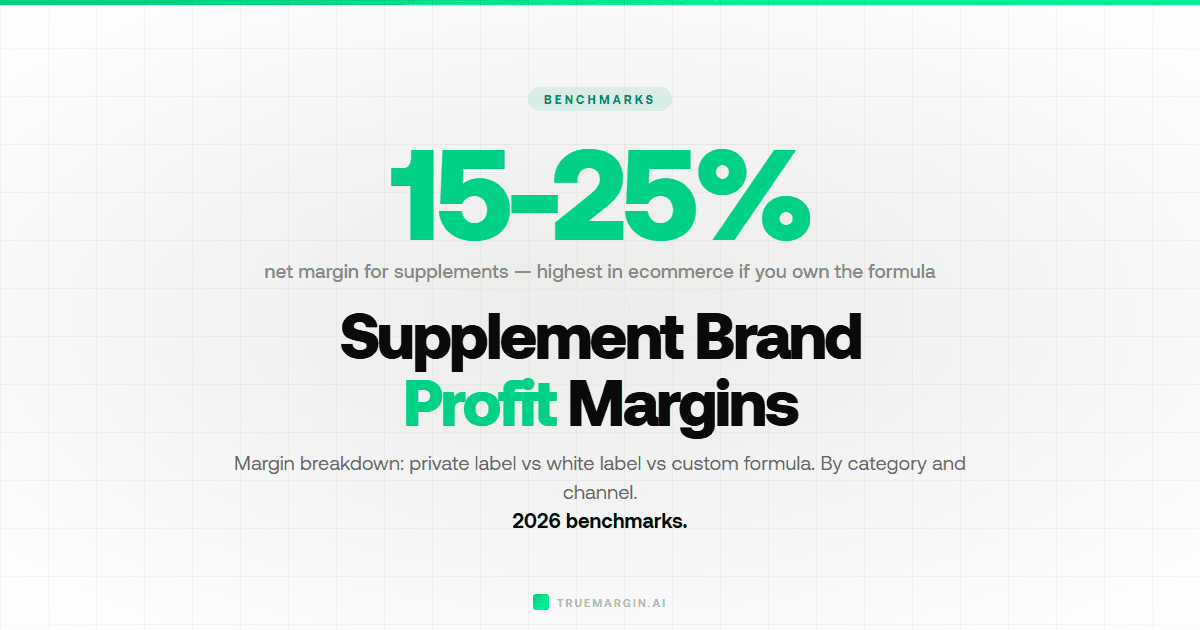
Supplement brands average 50-70% gross margins. See margins by type (protein, vitamins, collagen), white label vs custom, and subscription impact.
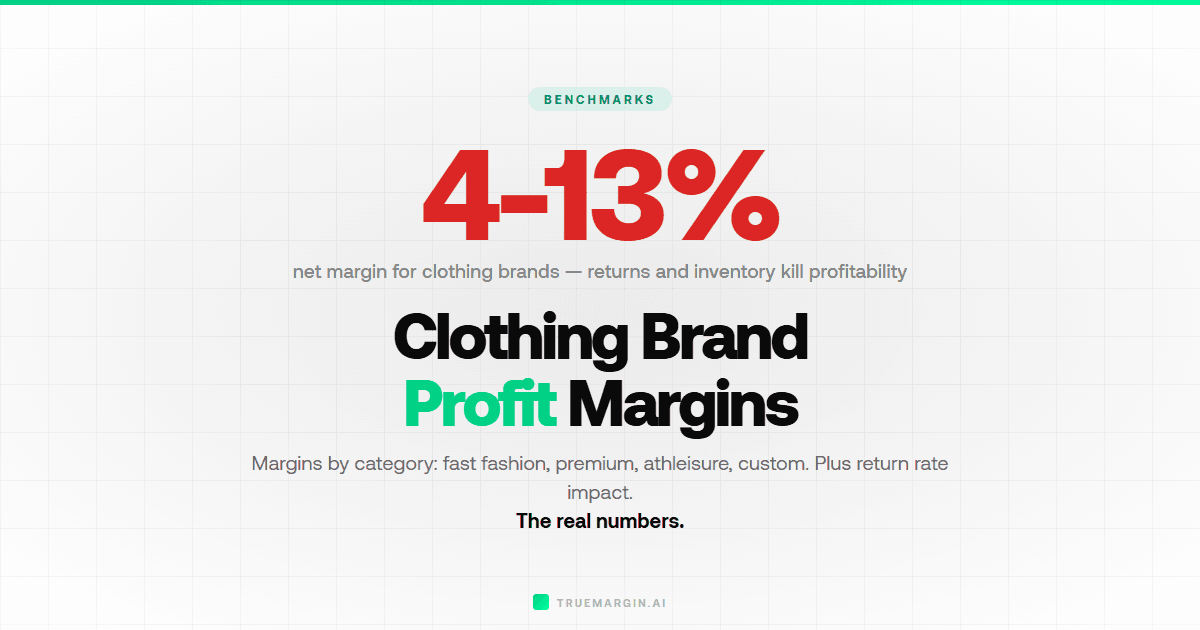
Clothing brands average 50-65% gross margins and 5-13% net. See margins by category (luxury, athleisure, streetwear) and manufacturing method.
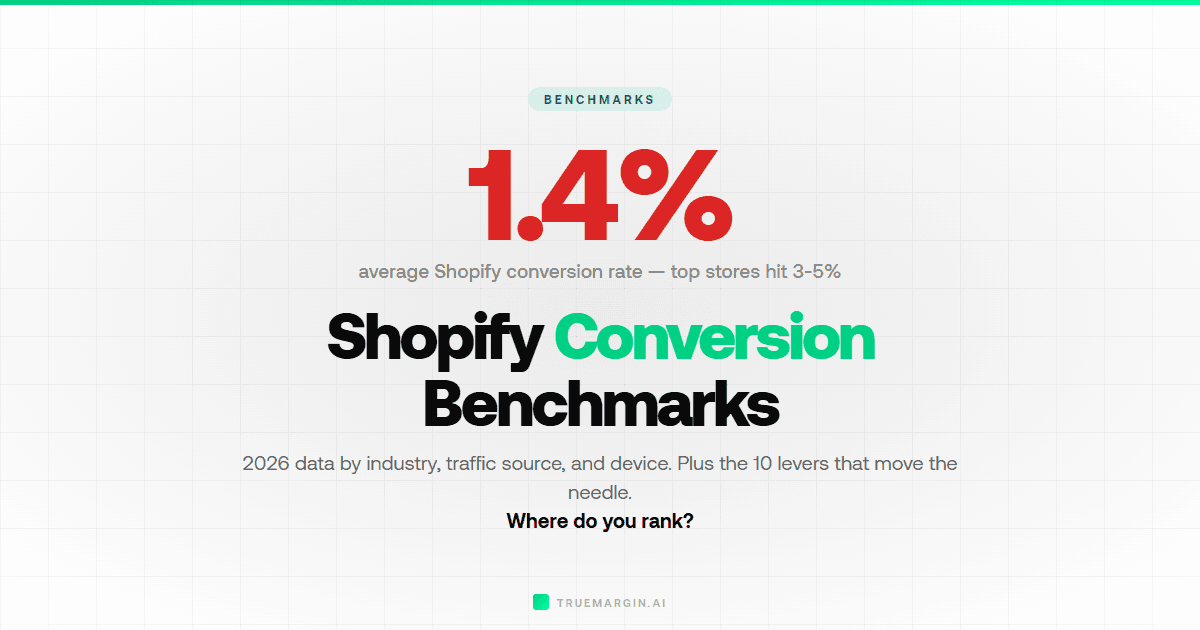
The average Shopify store converts at 1.4%. See conversion rates by industry, desktop vs mobile, and how to improve yours.
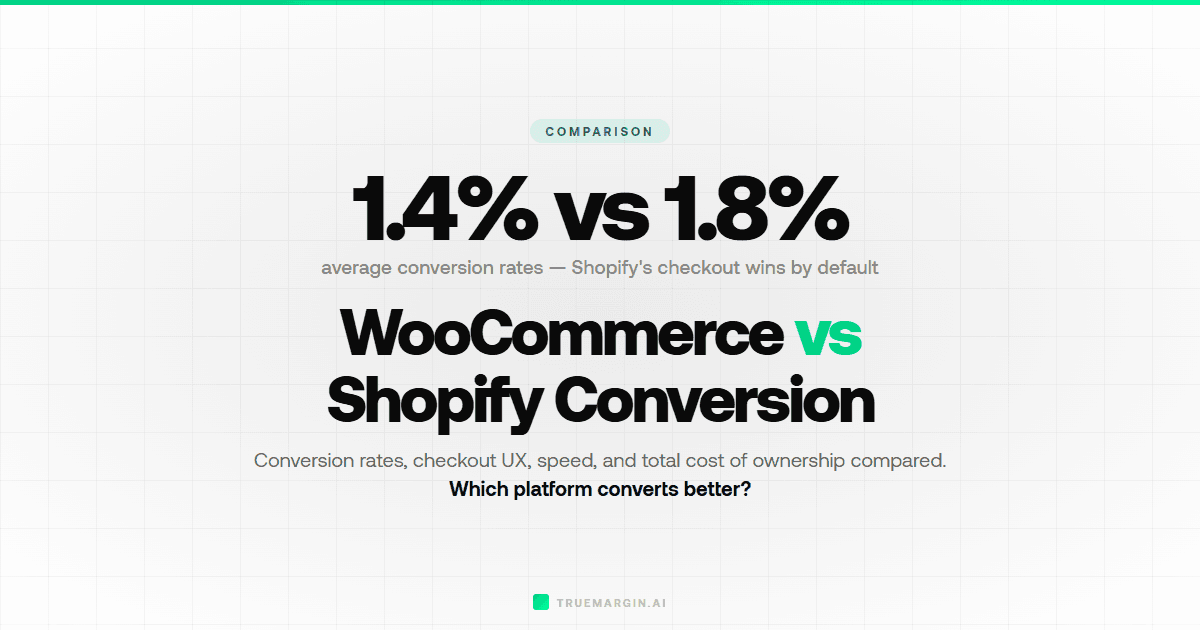
Shopify averages 1.4% conversion, WooCommerce 2-3%. See why the numbers differ, feature comparison, and how to improve either platform.
Pinterest ads cost $0.10-$1.50 per click with ROAS up to 6x for ecommerce. See cost benchmarks, ad formats, best niches, and how to set up.
Selling on Shopify, Amazon, and Walmart looks great for revenue — until fees eat your margins. See how to track true profitability by channel.
Build a financial model for your ecommerce business. See the 5 key components, step-by-step guide, cost categories, and common forecasting mistakes.
Bundle pricing increases AOV by 10-30%. See 5 bundle types, how to price them, profit margin impact, and common mistakes to avoid.
Loss leader pricing sells one product below cost to drive traffic and upsells. See when it works, when it backfires, and how to calculate if you can afford it.
Charm pricing, anchoring, decoy pricing, and more. See which psychological pricing tactics work for ecommerce, with research-backed data on each.
Ecommerce returns cost $10-$33 per item to process and consume 3-5% of revenue. See the full cost breakdown, return rates by industry, and how to reduce them.
Competitive pricing means setting prices based on what competitors charge. See 3 approaches, when to use each, and how to differentiate without price.
Set your free shipping threshold at 15-30% above your AOV. See the formula, step-by-step calculation, common ranges, and testing strategies.
Budget capping, ROAS above break-even, high conversion rate with low volume — 7 clear signals it's time to scale your ad spend.
Broken tracking, creative fatigue, wrong objectives, bad kill timing — the 10 mistakes ecom founders make that tank their ROAS and how to fix each one.
From beauty and supplements to digital products and print-on-demand — 8 product categories with real margin data and supplier tips.
Shopify plans, transaction fees, apps, themes, shipping, marketing — every cost broken down with real scenarios for $5K, $25K, and $100K/mo stores.
The five KPIs that actually move the needle — conversion rate, AOV, ROAS, contribution margin, and cart abandonment — and how to track them.
Pet supplies, health & wellness, and home office gear top the list. See 10 data-backed niches with market size, margins, competition levels, and supplier tips.
Health, beauty, pet, and home products lead with 40-70% margins. See the top dropshipping product categories with supplier data and margin analysis.
Most dropshipping stores take 6-12 months to hit $100K in revenue. See the month-by-month timeline, key milestones, and what separates winners from failures.
You can start dropshipping for $150-$500, but realistically need $1,000-$2,500 for ads, apps, and testing. See the full cost breakdown by category.
Dropshipping margins average 15-20% net after ads. See real revenue data, success rates, pros and cons, and whether it's still viable in 2026.
Dropshipping nets 15-20% margins with low startup cost. Brand building nets 25-40% but requires $10K+. See the full profitability comparison.
Vet suppliers by ordering samples, checking reviews, and verifying business licenses. See the 7-step process and red flags to avoid getting scammed.
AliExpress is cheapest, CJ has fastest shipping, Zendrop is most automated. See pricing, shipping times, and features compared side by side.
You can start dropshipping with $0 upfront using free trials and organic marketing. See the step-by-step plan, free tools, and realistic timeline to first sale.
Dropshippers owe income tax on profits and must collect sales tax in nexus states. See the full breakdown of what you owe, when to file, and how to stay compliant.
Most dropshippers take 3-6 months to become consistently profitable. See the realistic timeline, key milestones, and what separates fast starters from failures.
Realistic dropshipping net margins are 10-20% after all costs. See margin breakdowns by niche, the costs most beginners miss, and how to improve yours.
One-product stores convert 2-3x higher than general stores. See the full comparison on conversion rates, ad costs, margins, and when to use each model.
Hook in the first 3 seconds, lead with the problem, use UGC-style creative. See the full framework for high-converting Facebook ads with real examples.
A good CPC for Facebook Ads in ecommerce is $0.50-$2.00. See 2026 benchmarks by industry, campaign objective, and how CPC relates to ROAS and CPA.
Set up Business Manager, install the pixel, create a conversion campaign, and launch your first ad. Step-by-step beginner guide with budget recommendations.
Meta Ads has the highest ROAS for most ecommerce brands, but Google captures high-intent buyers. See all 6 platforms compared with cost and ROAS data.
Test one variable at a time — creative first, then audience, then copy. See the full testing framework with budget minimums and decision criteria.
Test 3-5 creatives per ad set at $20-50/day each. See the testing framework by budget level, how long to run tests, and when to kill underperformers.
Scale 20% every 48-72 hours, duplicate winning ad sets, and expand lookalikes gradually. See the step-by-step scaling playbook that protects your ROAS.
Use Meta Ad Library, TikTok Creative Center, and Google Ads Transparency to see exactly what your competitors are running. Full walkthrough with screenshots.
Kill ads with CPA 2x your target after 3+ days and 1,000+ impressions. See the decision framework with exact thresholds for every key metric.
UGC ads get higher CTR and lower CPA than polished studio ads for most ecommerce brands. See the performance data, cost comparison, and when to use each.
Lead with the problem, not the product. See the proven ad copy frameworks, hook formulas, and real examples that drive clicks and conversions.
UGC testimonials, before/after splits, unboxing videos, and problem-agitate hooks. See 10 proven ad creative formats with real ecommerce examples.
Retargeting ads convert 3-5x higher than cold traffic. See the step-by-step setup for custom audiences, dynamic product ads, and retargeting funnels.
Use TikTok Creative Center, Amazon Best Sellers, and Google Trends to spot trending products early. See the 7-step research framework with free tools.
Test demand with a landing page, run $50-100 in test ads, and check Google Trends before investing in inventory. See the 6-step validation framework.
Hero image above the fold, benefit-led copy, social proof near the buy button, and urgency triggers. See the full product page optimization checklist.
Price at 3-5x your landed cost, then adjust for perceived value. See the pricing frameworks, formulas by business model, and margin impact analysis.

To rank in ChatGPT search, build brand authority across Reddit, YouTube, review sites, and structured web content. This guide covers the 8 signals ChatGPT uses and the step-by-step optimization process.

AI product photography tools let you create studio-quality images for free. Compare the best free AI photo generators, learn the workflows, and see real before/after results.

Hand-tested ranking of the 15 best lead generation platforms for real estate investors in 2026 — wholesalers, flippers, buy-and-hold. Pricing, features, and who each one is actually for.