
Track both — but they answer different questions. ROAS (Return on Ad Spend) tells you how efficiently your ads generate revenue. ROI (Return on Investment) tells you whether you're actually making money. Most founders track ROAS because ad platforms hand it to them. Fewer calculate ROI — and that's where the expensive mistakes happen.
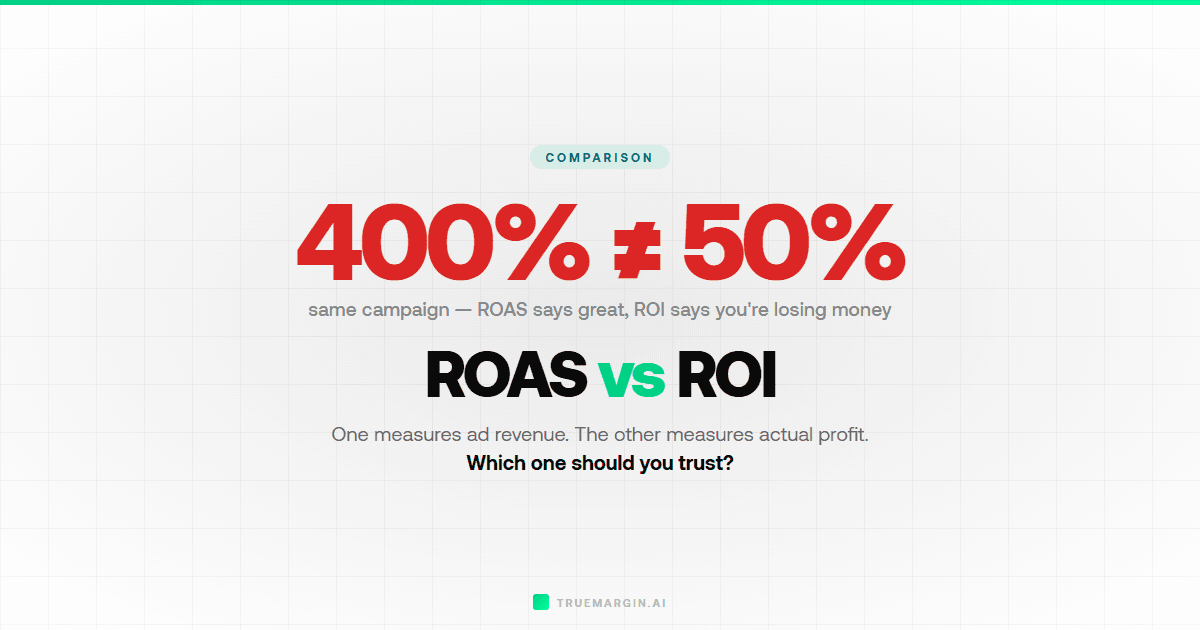
This article breaks down both formulas, shows exactly when each metric matters, and walks through a real example where a 4x ROAS produces negative ROI. If you're making budget decisions based on ROAS alone, you're flying blind.
The Formulas: ROAS vs ROI
Both metrics use revenue and costs, but they draw the line in different places:
- ROAS = Revenue from Ads ÷ Ad Spend
- ROI = (Revenue - Total Costs) ÷ Total Costs × 100
ROAS only looks at ad spend. ROI includes every cost — COGS, shipping, payment processing, ad spend, returns, overhead. That difference sounds small. It's not.
Side-by-Side Comparison
| ROAS | ROI | |
|---|---|---|
| Formula | Revenue ÷ Ad Spend | (Revenue - Total Costs) ÷ Total Costs |
| Expressed as | Multiple (4x) or percentage (400%) | Percentage (25%) |
| Includes COGS? | No | Yes |
| Includes shipping? | No | Yes |
| Includes overhead? | No | Yes |
| Available in ad platforms? | Yes (real-time) | No (manual calculation) |
| Best for | Campaign-level optimization | Business-level profitability decisions |
| Blind spot | Ignores all costs except ad spend | Harder to calculate, not real-time |
ROAS is a speed metric. ROI is a truth metric. ROAS tells you which campaigns to scale right now. ROI tells you whether scaling those campaigns actually puts money in your bank account. You need both. For a deeper dive on the ROAS formula itself, see our full guide on how to calculate ROAS.
How a 4x ROAS Can Equal Negative ROI
This is the scenario that burns founders. Your Meta Ads manager shows 4x ROAS. You think you're winning. You scale spend. Then your accountant tells you the business lost money last month.
Here's the math:
| Line Item | Amount |
|---|---|
| Ad Spend | $10,000 |
| Revenue from Ads | $40,000 |
| ROAS | 4.0x |
| COGS (55% of revenue) | -$22,000 |
| Shipping (avg $6/order, 500 orders) | -$3,000 |
| Payment processing (2.9% + $0.30) | -$1,310 |
| Returns (12% return rate) | -$4,800 |
| Ad Spend | -$10,000 |
| Total Costs | $41,110 |
| Net Profit | -$1,110 |
| ROI | -2.7% |
4x ROAS. Negative ROI. Lost $1,110. The ROAS looked healthy because it only measured revenue against ad spend. Once you layer in a 55% COGS, shipping, processing fees, and a 12% return rate, there's nothing left.
This brand needs either higher margins or a higher ROAS target. Their breakeven ROAS is actually closer to 4.1x, not the 2.5x-3x range most founders assume. Every dollar spent below 4.1x ROAS is money lost.
Find out if your ROAS is actually profitable
Plug in your ad spend, revenue, and costs. Our free calculator shows your ROAS, breakeven point, and real profit per dollar spent.
Open ROAS Calculator →When to Use ROAS
ROAS is the right metric for day-to-day campaign management. It's fast, it's available in real-time from every ad platform, and it lets you make quick decisions about where to spend more and where to cut.
Use ROAS when you're:
- Comparing ad sets or creatives within the same campaign
- Deciding which campaigns to scale and which to pause
- Evaluating platform performance (Facebook vs Google vs TikTok)
- Setting bid strategies and budget allocation
- Running A/B tests on audiences or placements
ROAS works here because you're comparing apples to apples. All campaigns share the same COGS, shipping, and processing costs. The only variable is ad spend efficiency — and that's exactly what ROAS measures. For platform-specific benchmarks, see our data on average Facebook Ads ROAS and average Google Ads ROAS.
When to Use ROI
ROI is the right metric for business decisions. It answers the question ROAS can't: "Am I actually making money?"
Use ROI when you're:
- Deciding whether to increase total ad spend next month
- Evaluating if a new product is worth advertising
- Reporting to investors or partners on profitability
- Comparing paid ads to other growth channels (SEO, email, organic)
- Setting annual marketing budgets
ROI forces you to account for everything. A product with 4x ROAS but 55% COGS and a 15% return rate is less profitable than a product with 2.5x ROAS but 25% COGS and a 3% return rate. ROAS would tell you to scale the first product. ROI would tell you to scale the second one.
Worked Example: Same Campaign, Both Metrics
Let's run both metrics on the same campaign to see how they tell different stories. A skincare brand spends $15,000 on Meta Ads in March:
| Metric | Calculation | Result |
|---|---|---|
| Revenue | $52,500 | |
| Ad Spend | $15,000 | |
| ROAS | $52,500 ÷ $15,000 | 3.5x |
| COGS (35%) | $52,500 × 0.35 | $18,375 |
| Shipping | 750 orders × $5.50 | $4,125 |
| Payment processing | $52,500 × 0.029 + (750 × $0.30) | $1,748 |
| Returns (8%) | $52,500 × 0.08 | $4,200 |
| Total Costs | $15,000 + $18,375 + $4,125 + $1,748 + $4,200 | $43,448 |
| Net Profit | $52,500 - $43,448 | $9,052 |
| ROI | $9,052 ÷ $43,448 × 100 | 20.8% |
3.5x ROAS and 20.8% ROI. Both are healthy. The ROAS tells the media buyer the campaign is efficient. The ROI tells the founder the campaign is profitable — $9,052 in real profit after every cost is accounted for.
Now watch what happens if this same brand had 55% COGS instead of 35%. ROAS stays 3.5x (it doesn't care about COGS). But total costs jump to $53,948, and the ROI flips to -2.7%. Same ROAS. Opposite conclusion.
This is why knowing your profit margins is the foundation of every ad decision. Without margins, ROAS is just a vanity number.
ROAS and ROI at Different Margin Levels
The relationship between ROAS and ROI depends entirely on your margins. Here's what a 3x ROAS actually means in ROI terms at different margin levels (assuming $10,000 ad spend, $30,000 revenue, and standard shipping/processing costs):
| Gross Margin | ROAS | Gross Profit | Approx. ROI | Verdict |
|---|---|---|---|---|
| 20% | 3.0x | $6,000 | -16.7% | Losing money |
| 30% | 3.0x | $9,000 | -2.5% | Barely breaking even |
| 40% | 3.0x | $12,000 | 11.1% | Modestly profitable |
| 50% | 3.0x | $15,000 | 25.0% | Healthy profit |
| 60% | 3.0x | $18,000 | 38.5% | Strong profit |
| 70% | 3.0x | $21,000 | 52.4% | Excellent — scale aggressively |
Same 3x ROAS across the board. ROI ranges from -16.7% to +52.4%. The ROAS number is identical. The business outcome is completely different. This is the entire argument for tracking both metrics.
Don't know your margins? Use our free profit margin calculator to get the number. Then plug it into the ROAS calculator to see what your breakeven target should be.
The Verdict: Track Both, Use Each for Its Job
This isn't a "pick one" situation. ROAS and ROI serve different purposes, and you need both to run a profitable ad operation:
Optimize campaigns on ROAS. It's real-time, it's in every ad platform, and it's the right tool for comparing campaigns against each other. Set your ROAS targets based on your breakeven ROAS (1 ÷ your profit margin) plus a 20-30% buffer for overhead.
Make business decisions on ROI. Should you increase total ad spend? Is this product line worth advertising? Should you hire an agency? These are ROI questions. ROAS can't answer them because it doesn't include the costs that determine whether you actually profit.
Connect the two with your margins. If you know your gross margin and your cost per acquisition, you can translate any ROAS number into an approximate ROI in your head. A 3x ROAS at 50% margin means roughly 25% ROI. A 3x ROAS at 30% margin means roughly breakeven. Once you internalize that relationship, both metrics become useful at a glance.
The founders who lose money aren't the ones with bad ROAS. They're the ones who never check ROI. Track both. Optimize with ROAS. Decide with ROI.
Frequently Asked Questions
What is the difference between ROAS and ROI?
ROAS (Return on Ad Spend) = Revenue ÷ Ad Spend. It measures how much revenue your ads generate per dollar spent. ROI (Return on Investment) = (Revenue - Total Costs) ÷ Total Costs. It measures actual profit after all expenses. ROAS ignores product costs, shipping, and overhead. ROI includes everything.
Can you have a high ROAS but negative ROI?
Yes. A 4x ROAS on a product with 20% margins means you brought in $4 in revenue for every $1 in ad spend, but $3.20 of that went to COGS, shipping, and fees. Your gross profit per ad dollar is only $0.80 — less than the $1 you spent. High ROAS with thin margins often equals negative ROI.
When should I use ROAS vs ROI?
Use ROAS for day-to-day campaign optimization — comparing ad sets, testing creatives, and deciding where to allocate budget. Use ROI for business-level decisions — whether to scale spend, enter a new channel, or evaluate if your overall ad strategy is actually making money after all costs.
What is a good ROAS and ROI for ecommerce?
A good ROAS depends on your margins. The common benchmark is 3x-4x, but a brand with 70% margins profits at 1.5x while a brand with 25% margins needs 4x+ to break even. A good ROI for ecommerce advertising is 15-30% — meaning you earn 15-30 cents of profit for every dollar of total costs invested.
How do I calculate ROI on my ad campaigns?
ROI = (Revenue - Total Costs) ÷ Total Costs × 100. Total costs include ad spend plus COGS, shipping, payment processing, returns, and any other variable costs. Example: $20,000 revenue - $17,500 total costs = $2,500 profit. ROI = $2,500 ÷ $17,500 = 14.3%.
Should I optimize my campaigns for ROAS or ROI?
Optimize campaigns for ROAS — it's faster, simpler, and available in real-time from ad platforms. But validate with ROI monthly to make sure your ROAS targets actually produce profit. Set your ROAS target based on your breakeven ROAS (1 ÷ profit margin), which ensures every campaign above that target generates positive ROI.