
Revenue tells you how much money came in. A profit and loss statement tells you how much you actually kept. That distinction is the difference between an ecommerce brand that looks successful on a Shopify dashboard and one that is genuinely profitable. A P&L forces you to confront every dollar that leaves the business — not just COGS, but the ad spend, shipping costs, platform fees, returns, and software subscriptions that silently erode your margins.
If you have ever ended the month wondering why your bank balance does not match your revenue numbers, you need a P&L. This guide walks through the anatomy of an ecommerce profit and loss statement, breaks down each line item with ecommerce-specific context, shows a real example at $50,000 per month in revenue, and identifies the five line items that kill margins most often.
What a P&L Is and Why It Matters
A profit and loss statement — also called an income statement or P&L — is a financial report that summarizes your revenue, costs, and expenses over a specific period. It answers one question: did the business make money or lose money?
For ecommerce founders, the P&L matters because revenue and profit are not the same thing. A brand doing $100,000 per month in revenue can easily be losing money if ad spend, shipping, and returns consume more than the gross margin generates. Without a P&L, you are flying blind — making decisions based on top-line revenue while costs quietly compound underneath.
The P&L is also the document investors, lenders, and potential acquirers will ask for first. It is the standard language of business performance. If you cannot produce a clean, accurate P&L, you cannot raise capital, secure a line of credit, or sell your business at a fair valuation.
Anatomy of an Ecommerce P&L
Every P&L follows the same top-to-bottom structure. Here is the framework, adapted for ecommerce:
| Section | What It Includes | Why It Matters |
|---|---|---|
| Revenue | Gross sales, minus discounts, refunds, and returns | Your true top line — what customers actually paid and kept |
| Cost of Goods Sold (COGS) | Product cost, packaging, inbound freight, duties | Direct cost of the product itself — determines gross margin |
| Gross Profit | Revenue minus COGS | How much margin the product generates before business expenses |
| Operating Expenses | Ads, shipping, fees, software, labor, overhead | Everything it costs to run the business beyond the product itself |
| Net Income | Gross profit minus operating expenses | What you actually keep — the bottom line |
The critical insight: gross profit can look healthy while net income is negative. A 65% gross margin means nothing if operating expenses consume 70% of revenue. The P&L forces you to see both layers in one view.
Line-by-Line Breakdown: Ecommerce-Specific Items
A generic P&L template from an accounting textbook will not work for ecommerce. You need line items that reflect where ecommerce money actually goes. Here is the full breakdown.
Revenue Section
- Gross sales: Total amount charged to customers before any adjustments. This is what your Shopify or platform dashboard shows as total sales.
- Discounts: Coupon codes, automatic discounts, promotional pricing. Subtract this from gross sales.
- Refunds and returns: Money returned to customers. The average ecommerce return rate varies by category, but it can represent a meaningful percentage of gross sales.
- Net revenue: Gross sales minus discounts minus refunds. This is your true top line.
Cost of Goods Sold (COGS)
COGS includes every cost directly tied to producing or acquiring the product:
- Product cost: Manufacturing, wholesale purchase, or raw materials.
- Packaging: Boxes, inserts, branded tissue paper, labels.
- Inbound freight: Getting the product from the manufacturer or supplier to your warehouse or 3PL.
- Import duties and tariffs: If you source internationally, these belong in COGS.
COGS does not include outbound shipping to customers, advertising, or platform fees. Those go in operating expenses. Getting this classification wrong inflates your gross margin and distorts every decision downstream.
Operating Expenses
This is where ecommerce gets specific. Here are the line items that belong in your operating expenses section:
- Advertising and marketing: Facebook/Meta Ads, Google Ads, TikTok Ads, influencer payments, affiliate commissions, email marketing platform costs. For most DTC brands, this is the single largest operating expense — typically 15-30% of revenue.
- Shipping and fulfillment: Outbound shipping to customers, 3PL pick-and-pack fees, packaging materials for outbound orders. If you offer free shipping, this cost is entirely on you.
- Platform and transaction fees: Shopify subscription, Shopify Payments or Stripe processing fees (2.9% + $0.30 per transaction), Amazon referral fees, marketplace commissions. See our unit economics guide for how these compound.
- Returns and chargebacks: Return shipping labels, restocking labor, damaged inventory write-offs, chargeback fees ($15-25 per dispute). This is separate from the refund itself, which adjusts your revenue line.
- Software and tools: Klaviyo, analytics tools, review apps, subscription management, accounting software, inventory management. These subscriptions add up — a typical Shopify brand runs 8-15 apps.
- Payroll and contractors: Customer service reps, virtual assistants, freelance designers, bookkeepers.
- General overhead: Warehouse rent, insurance, office supplies, miscellaneous costs that do not fit neatly elsewhere.
Real P&L Example at $50K per Month Revenue
Here is what a realistic ecommerce P&L looks like for a DTC brand doing $50,000 per month in revenue, selling a $50 product (approximately 1,100 gross orders, with some returning product):
| Line Item | Amount | % of Net Revenue |
|---|---|---|
| Gross Sales | $55,000 | — |
| Discounts | -$2,750 | — |
| Refunds | -$2,250 | — |
| Net Revenue | $50,000 | 100% |
| COGS (product + packaging + inbound freight) | -$16,000 | 32.0% |
| Gross Profit | $34,000 | 68.0% |
| Advertising (Meta + Google Ads) | -$11,500 | 23.0% |
| Shipping & fulfillment | -$5,200 | 10.4% |
| Payment processing (2.9% + $0.30) | -$1,780 | 3.6% |
| Shopify plan + apps | -$450 | 0.9% |
| Returns processing & chargebacks | -$800 | 1.6% |
| Software & tools (Klaviyo, analytics, etc.) | -$600 | 1.2% |
| Payroll & contractors | -$3,000 | 6.0% |
| General overhead | -$500 | 1.0% |
| Total Operating Expenses | -$23,830 | 47.7% |
| Net Income | $10,170 | 20.3% |
This brand keeps $10,170 out of $50,000 in net revenue — a 20.3% net margin. That is above average for ecommerce. The key drivers: reasonable COGS (32%), controlled ad spend (23% of revenue), and a manageable return rate. Change any one of those variables significantly and the bottom line shifts fast.
If ad spend climbs to 30% of revenue, net income drops to $6,670 (13.3%). If COGS rises to 40%, net income drops to $6,170 (12.3%). Both at the same time? Net income falls to $2,670 (5.3%). This is why reviewing your P&L monthly matters — small cost creep compounds quickly.
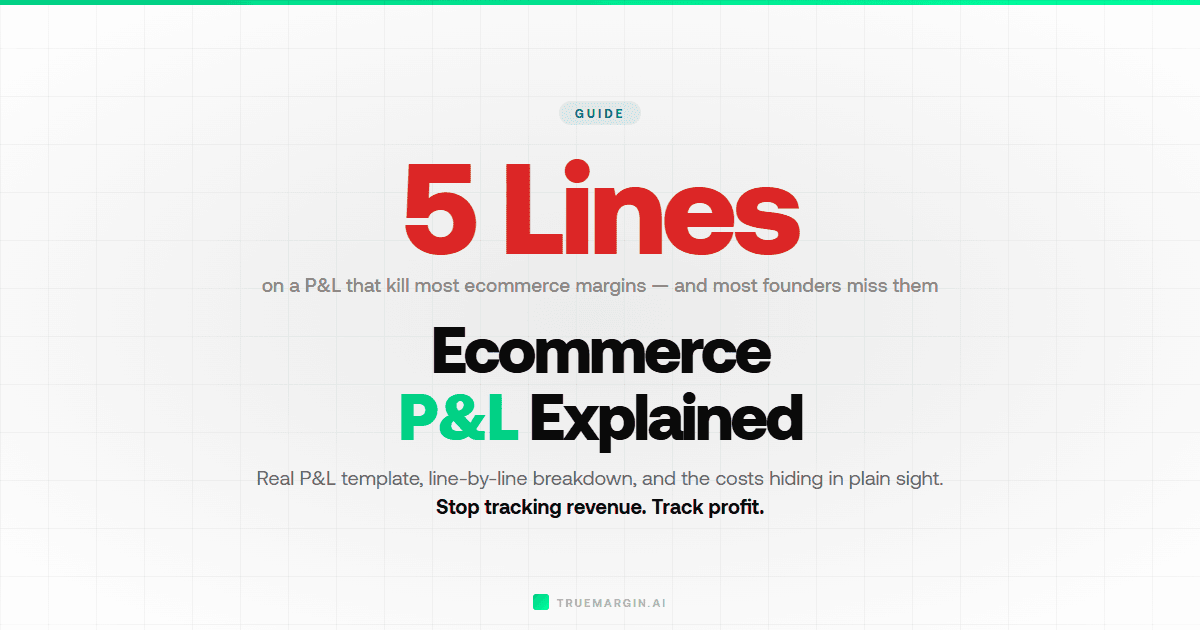
The 5 Line Items That Kill Ecommerce Margins
Five line items most commonly cause margin damage on ecommerce P&Ls. If your net margin is weaker than expected, start investigating here.
1. Advertising and Customer Acquisition
Ad spend is the largest variable cost for most DTC brands and the one that fluctuates most. A shift in CPM on Meta, a creative that fatigues, or a seasonal spike in competition can push ad spend from 20% of revenue to 35% in a single month. Every percentage point of ad spend above your target comes directly out of net income. Monitor your ad-to-revenue ratio weekly, not monthly.
2. Shipping and Fulfillment
Offering free shipping feels like a competitive necessity, but it transfers the full cost to your P&L. On a $50 product, $5-7 in shipping represents 10-14% of revenue. For heavier or bulky items, it can be worse. Brands that build shipping into their pricing or set free shipping thresholds above their AOV protect their margins without losing conversion rate.
3. Returns and Chargebacks
Returns hit your P&L twice: the refund reduces revenue, and the processing cost (return label, restocking, damaged inventory) appears as an operating expense. A return rate increase from 5% to 10% does not just double the line item — it cascades through your entire P&L. The original ad spend to acquire that order is also wasted.
4. Platform and Transaction Fees
Payment processing alone costs 2.9% + $0.30 per transaction on most platforms. Add the Shopify subscription, any transaction fees for third-party gateways, and app charges, and platform costs typically total 4-6% of revenue. On Amazon, the total can reach 30-40% when you combine referral fees, FBA fees, and storage charges.
5. Software and App Subscriptions
Individually, no single app seems expensive. But a typical Shopify store runs 8-15 paid apps: email marketing, reviews, upsells, analytics, subscription management, inventory, returns portal, and more. At $30-200 per month each, these quietly add up to $500-2,000 per month. On a $50,000 revenue month that is 1-4% of revenue — pure margin erosion that is easy to overlook. Audit your app stack quarterly and cut anything you are not actively using.
Monthly vs Quarterly P&L Review
Monthly reviews catch problems. Quarterly reviews reveal patterns. You need both.
A monthly P&L review should take 30-60 minutes. Pull your revenue, costs, and expenses from the prior month. Compare each line item to the month before it. Flag anything that moved more than 2-3 percentage points as a share of revenue. Investigate why. The goal is to catch cost creep early — before a rising CPA or shipping rate compounds over multiple months.
A quarterly review goes deeper. Compare the same quarter year-over-year if you have the data. Look at trends: is your ad spend as a percentage of revenue rising or falling? Is your gross margin improving as you negotiate better supplier terms, or declining as tariffs increase? Are you spending more on software than you were six months ago?
The quarterly review is also where you make strategic decisions: whether to cut a product line, shift budget between channels, adjust pricing, or renegotiate a supplier contract. Monthly reviews are operational. Quarterly reviews are strategic. Both feed the P&L.
True Margin helps you track these numbers in real time so your monthly review takes minutes instead of hours. No more pulling data from five different dashboards and reconciling in a spreadsheet.
How to Build Your Ecommerce P&L
You do not need an accountant to build a working P&L. Here is a step-by-step process you can follow today.
Step 1: Start with net revenue. Pull your gross sales from Shopify or your platform. Subtract discounts and refunds. This is your true top line. Do not use gross sales as your revenue number — it overstates reality.
Step 2: Calculate COGS. For each product, add up manufacturing cost, packaging, inbound freight, and any duties. Multiply by units sold. If you are not sure of your exact COGS per unit, your supplier invoices and freight bills from the last quarter are the best starting point.
Step 3: List every operating expense. Go through your bank and credit card statements for the month. Categorize every charge into the line items above: advertising, shipping, platform fees, software, payroll, overhead. Miss nothing. The costs you forget are the ones that make your P&L inaccurate.
Step 4: Subtract and calculate percentages. Revenue minus COGS equals gross profit. Gross profit minus total operating expenses equals net income. Express each line item as a percentage of net revenue so you can compare months against each other regardless of volume changes.
Step 5: Compare to benchmarks. Here are target ranges for a healthy ecommerce P&L:
| Line Item | Healthy Range (% of Revenue) | Red Flag Threshold |
|---|---|---|
| COGS | 25-40% | Above 50% |
| Gross margin | 60-75% | Below 50% |
| Ad spend | 15-25% | Above 30% |
| Shipping & fulfillment | 8-12% | Above 15% |
| Platform & payment fees | 3-5% | Above 6% |
| Returns & chargebacks | 1-3% | Above 5% |
| Software & tools | 1-2% | Above 3% |
| Net income | 10-20% | Below 5% |
If any line item sits in the red flag zone, that is where you focus first. A single out-of-range cost category can be the difference between a 15% net margin and break-even. Our profit margin calculator lets you model different scenarios quickly — plug in your numbers and see how adjusting each cost category changes your bottom line.
Model your P&L in seconds, not hours.
Plug in your revenue, COGS, ad spend, and fees to see your real net margin instantly. No spreadsheet required.
Open Profit Margin Calculator →Putting Your P&L to Work
Building the P&L is step one. Using it to make better decisions is where the value lives. Here are three actions you can take immediately once your P&L is in place:
Identify your highest-leverage fix. Look at the line item that consumes the largest share of revenue after COGS. For most brands, that is ad spend. Even a small improvement — reducing CPA by 10% — drops straight to net income. Use the profit margin formula to model the impact before making changes.
Set cost guardrails. Define a maximum percentage of revenue for each major cost category and review them monthly. If ad spend is capped at 25% and it hits 27%, that triggers an immediate review of campaign performance — not a quarterly realization that margins eroded.
Track cash flow alongside the P&L. A P&L shows profitability on paper, but cash flow shows whether the money is actually in your bank account when you need it. Inventory purchases, prepaid ad spend, and payment processor hold periods create timing gaps between P&L profit and available cash. Track both.
Frequently Asked Questions
What is a profit and loss statement for ecommerce?
A profit and loss statement (also called an income statement or P&L) is a financial report that summarizes your ecommerce revenue, cost of goods sold, operating expenses, and net income over a specific period. It shows whether your business actually made money or lost money after accounting for every cost — not just COGS, but ad spend, shipping, returns, platform fees, and overhead.
What line items should an ecommerce P&L include?
An ecommerce P&L should include gross revenue, discounts and refunds (to arrive at net revenue), cost of goods sold, gross profit, then operating expenses broken out individually: advertising and marketing, shipping and fulfillment, platform and transaction fees, software and tools, returns and chargebacks, and general overhead. Subtract total operating expenses from gross profit to arrive at net income.
How often should I review my ecommerce P&L?
Review your P&L monthly at minimum. Monthly reviews catch problems early — a rising ad cost or creeping return rate shows up within 30 days. Quarterly reviews are better for spotting seasonal trends and making strategic decisions about product mix, pricing, and channel allocation. True Margin makes this easier by centralizing your cost data so monthly reviews take minutes instead of hours.
What is the difference between gross profit and net income on a P&L?
Gross profit is revenue minus cost of goods sold only. It tells you how much margin the product itself generates before any business expenses. Net income is what remains after subtracting all operating expenses — advertising, shipping, fees, software, and overhead — from gross profit. A business can have strong gross profit and still lose money if operating expenses consume too much.
What percentage of revenue should ad spend be on an ecommerce P&L?
Most profitable ecommerce brands keep ad spend between 15-25% of revenue. Above 30% and it becomes very difficult to maintain a positive net income unless your gross margins are exceptionally high (above 70%). The right number depends on your gross margin, customer lifetime value, and growth goals. Brands focused on aggressive growth may temporarily accept higher ratios, but anything above 35% sustained is a warning sign.