
Most ecommerce founders check their revenue every day. Very few check the five numbers that actually determine whether that revenue turns into profit.
Revenue is a vanity metric on its own. You can do $50K in a month and lose money. You can do $20K and pocket $8K. The difference is whether you are tracking the right ecommerce metrics to track daily — the ones that expose problems before they compound into a bad month.
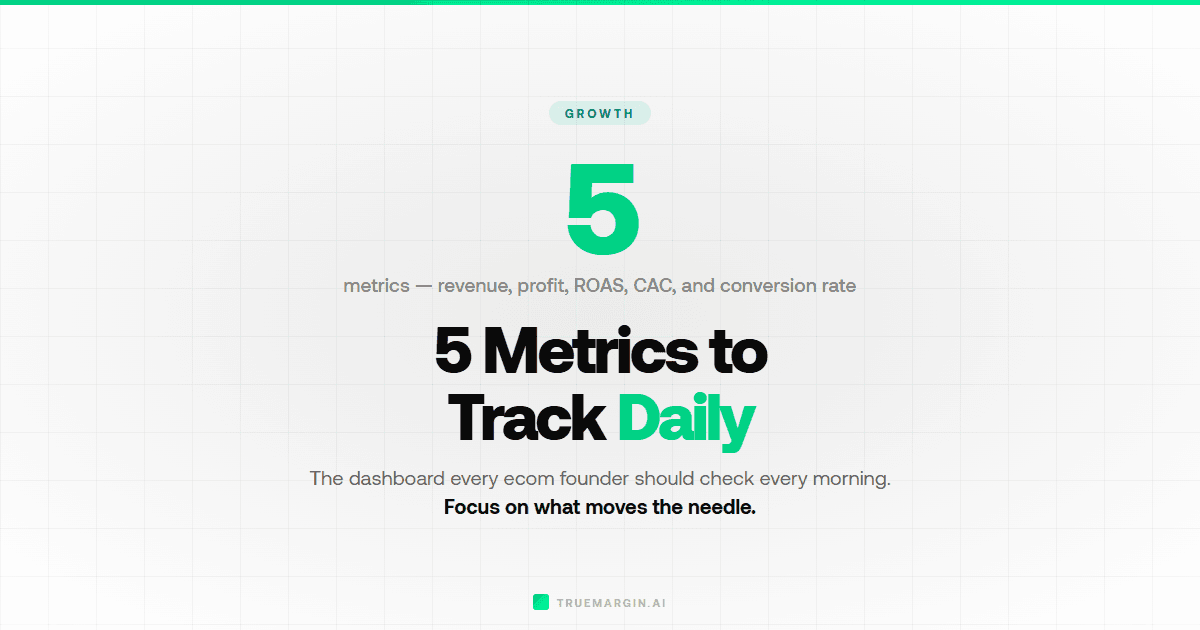
Here are the five numbers you should be looking at every single morning, with 2026 benchmarks and the formulas behind each one.
1. Conversion Rate
What it measures: the percentage of visitors who complete a purchase.
Formula: (Orders / Sessions) x 100
The average ecommerce conversion rate is 2.5-3% globally. But averages hide a massive spread — food and beverage stores can average over 5% while luxury and jewelry sits under 1%. Your benchmark depends on your industry, price point, and traffic mix.
| Industry | Avg Conversion Rate | Target (Top 25%) |
|---|---|---|
| Food & Beverage | 4-6% | 7%+ |
| Beauty & Personal Care | 3-5% | 6%+ |
| Fashion & Apparel | 2-3% | 4%+ |
| Health & Wellness | 2-4% | 4%+ |
| Electronics | 1-2% | 2.5%+ |
| Luxury & Jewelry | under 1% | 1.5%+ |
Why track it daily: Conversion rate is your canary in the coal mine. A sudden drop signals something is broken — a page error, a broken checkout flow, a bad ad driving unqualified traffic. Catching a 0.5% drop on day one is a quick fix. Discovering it at end of month means you already lost thousands.
Pro tip: Segment by device. Mobile drives 70-78% of ecommerce traffic but converts at roughly half the rate of desktop (1.5-2% vs 3.5-4%). If your blended rate drops but desktop stays flat, you have a mobile-specific problem.
2. Average Order Value (AOV)
What it measures: the average dollar amount spent per order.
Formula: Total Revenue / Number of Orders
According to ECDB, the global ecommerce average order value is approximately $109-$116. But like conversion rate, this varies dramatically by vertical — pet care averages around $68 while luxury can exceed $350.
| Industry | Avg AOV |
|---|---|
| Luxury & Jewelry | $350+ |
| Electronics | $200-$250 |
| Home & Furniture | $150-$200 |
| Fashion & Apparel | $100-$130 |
| Health & Wellness | $70-$90 |
| Pet Care | $60-$70 |
| Food & Beverage | $50-$70 |
Why track it daily: AOV tells you whether customers are buying more or less per order — and that directly impacts whether your ad spend is profitable. If your customer acquisition cost is $25 and your AOV drops from $90 to $65, you went from a healthy order to a barely-break-even one — with the same ad spend.
How to increase it: Bundle offers, free shipping thresholds (set them 20-30% above your current AOV), upsells at checkout, and volume discounts. Even a $10 bump in AOV, multiplied by thousands of orders, dramatically changes your bottom line. Read our full guide on how to increase average order value.
What ROAS do you actually need to be profitable?
Most founders guess. Plug your AOV, margins, and ad spend into our calculator and get the exact breakeven ROAS for your business — in under 60 seconds.
Open Free ROAS Calculator →3. ROAS (Return on Ad Spend)
What it measures: how much revenue you generate for every dollar spent on advertising.
Formula: Revenue from Ads / Ad Spend
If you spend $1,000 on Meta ads and those ads generate $4,000 in revenue, your ROAS is 4.0x. According to Triple Whale's 2025 benchmark data, the median Facebook Ads ROAS for ecommerce is around 2-3x, while Google Ads ROAS tends to run higher at 4-8x (due to higher purchase intent on search).
But ROAS alone is misleading. A 4x ROAS sounds great until you realize your margins are 25% — meaning you only keep $1,000 out of $4,000 in revenue, which is exactly what you spent. That's breakeven, not profit. This is why you need to understand your breakeven ROAS — the minimum ROAS required to cover your variable costs per order.
Why track it daily: ROAS tells you whether your ad spend is working right now. Algorithms shift, creative fatigues, CPMs fluctuate. A ROAS that was 4x on Monday can be 2x by Thursday. If you only check weekly, you've burned through budget on underperforming campaigns for days.
ROAS vs. MER: Channel-level ROAS can be misleading because of attribution issues. Many founders also track MER (Marketing Efficiency Ratio) — total revenue divided by total marketing spend — which gives a blended view. A healthy MER for most DTC brands is 3-5x. Read our breakdown of ROAS vs. MER to understand when to use each.
4. Contribution Margin per Order
What it measures: how much actual profit you keep from each order after all variable costs.
Formula: Revenue - COGS - Shipping - Transaction Fees - Ad Cost per Acquisition
This is the metric most ecommerce founders skip — and it's the one that matters most. Revenue is not profit. A $100 order with $30 COGS, $8 shipping, $4 in payment processing, and $25 in ad costs leaves you with $33 in contribution margin (33%). That $33 is what pays for your fixed costs — software, team, rent — and whatever is left after that is actual profit.
| Cost Component | Example ($100 Order) | % of Revenue |
|---|---|---|
| Revenue | $100.00 | 100% |
| COGS | -$30.00 | 30% |
| Shipping | -$8.00 | 8% |
| Transaction fees | -$4.00 | 4% |
| Ad cost (CPA) | -$25.00 | 25% |
| Contribution Margin | $33.00 | 33% |
Why track it daily: Contribution margin is the only metric that tells you if an order actually made money. You can have a "good" ROAS and still lose money per order if your COGS, shipping, or fees are eating your margins. Tracking this daily catches margin erosion in real time — before it shows up as a bad month on your P&L.
If you're not sure what your per-order economics look like, start by running your numbers through our profit margin calculator or our Shopify profit calculator. For a deeper dive into the framework, read our guide on ecommerce unit economics.
5. Cart Abandonment Rate
What it measures: the percentage of shoppers who add items to cart but leave without purchasing.
Formula: (1 - (Completed Orders / Carts Created)) x 100
The average cart abandonment rate is approximately 70%, based on aggregated data from the Baymard Institute. On mobile, it's even higher — roughly 79-85%. That means 7 out of 10 people who show clear buying intent (they added something to cart) walk away.
The top reasons shoppers abandon carts, according to Baymard's research:
- Unexpected costs (48%) — shipping, tax, or fees shown only at checkout
- Required account creation (26%) — forcing sign-up before purchase
- Too long/complicated checkout (22%) — too many form fields and steps
- Couldn't calculate total cost upfront (16%) — no shipping estimate on product page
- Didn't trust the site (18%) — no reviews, missing payment security badges
Why track it daily: A spike in abandonment often signals a checkout issue — a broken payment method, a new shipping rate that feels too high, or a promo code that isn't applying. These are fixable problems, but only if you see them quickly. For every 1% you reduce cart abandonment, you get more completed orders from traffic you already paid for. Read our full playbook on how to reduce cart abandonment.
The Daily Metrics Dashboard
Here is a quick-reference snapshot of what to check each morning and the benchmarks that should trigger action:
| Metric | Benchmark | Action Trigger |
|---|---|---|
| Conversion Rate | 2.5-3% (varies by industry) | Drops >0.5% from 7-day avg |
| Average Order Value | $109-$116 (global avg) | Drops >10% from 7-day avg |
| ROAS / MER | 3-4x channel / 3-5x blended | Falls below your breakeven ROAS |
| Contribution Margin | 30-40% per order | Drops below 20% |
| Cart Abandonment | ~70% | Spikes >5% above your baseline |
The key is not obsessing over absolute numbers — it's spotting directional changes. A 2.2% conversion rate is fine if that's your steady state. A 2.2% conversion rate that was 3.1% three days ago is an emergency. Daily tracking is about catching drift before it becomes damage.
What Not to Track Daily
Not every metric needs daily attention. These are important but better suited to weekly or monthly review:
- Customer Lifetime Value (LTV) — Changes slowly over months. Check monthly or quarterly.
- Customer Acquisition Cost (CAC) — Daily CAC is too noisy. Weekly is the right cadence for channel-level CAC.
- Return Rate — Returns take days to weeks to happen. Check weekly.
- Net Promoter Score (NPS) — Survey-based, slow-moving. Monthly at most.
The goal is not to track everything — it's to track the right things at the right frequency. The five daily metrics above give you the earliest signal on store health. Everything else can wait for your weekly or monthly review.
Run Your Numbers
Knowing the benchmarks is step one. Step two is plugging in your actual numbers to see where you stand and how improvements compound.
Get your real numbers — not benchmarks
Benchmarks tell you what's average. Our free calculators tell you what's profitable for YOUR business. Start with ROAS — it connects ad spend, margins, and profit in one number.
Frequently Asked Questions
What ecommerce metrics should I track daily?
The five ecommerce metrics every founder should track daily are: conversion rate (benchmark 2.5-3%), average order value, ROAS or MER, contribution margin per order, and cart abandonment rate (benchmark ~70%). These five numbers tell you whether your store is making money or bleeding it — before your monthly P&L confirms it too late.
What is a good ROAS for ecommerce?
A good ROAS depends on your margins. For most ecommerce brands, 3-4x ROAS on paid channels is considered healthy. But if your margins are thin (under 30%), you may need 5x+ to break even. The better blended metric is MER — total revenue divided by total marketing spend — where a healthy range for most DTC brands is 3-5x.
How do I calculate contribution margin per order?
Contribution margin per order = Revenue - COGS - Shipping - Transaction Fees - Ad Cost per Acquisition. For example: a $75 order with $22 COGS, $6 shipping, $3 transaction fees, and $18 ad cost gives you $26 in contribution margin (34.7%). This is the real profit per order before fixed costs. If this number is negative, you are losing money on every sale. See our gross margin vs. contribution margin guide for more.
What is the average cart abandonment rate?
The average cart abandonment rate across ecommerce is approximately 70%, according to Baymard Institute research. Mobile abandonment runs higher at 79-85%. The top drivers are unexpected shipping costs (48%), required account creation (26%), and a checkout process that is too complex (22%).
Should I track revenue or profit daily?
Both — but profit matters more. Revenue tells you how much money came in. Contribution margin tells you how much you actually kept. Many brands scale revenue while margins shrink, ending up busier but not more profitable. Track revenue for momentum, but track contribution margin to know if the business is actually working. For a complete breakdown, read revenue vs. profit in ecommerce.