
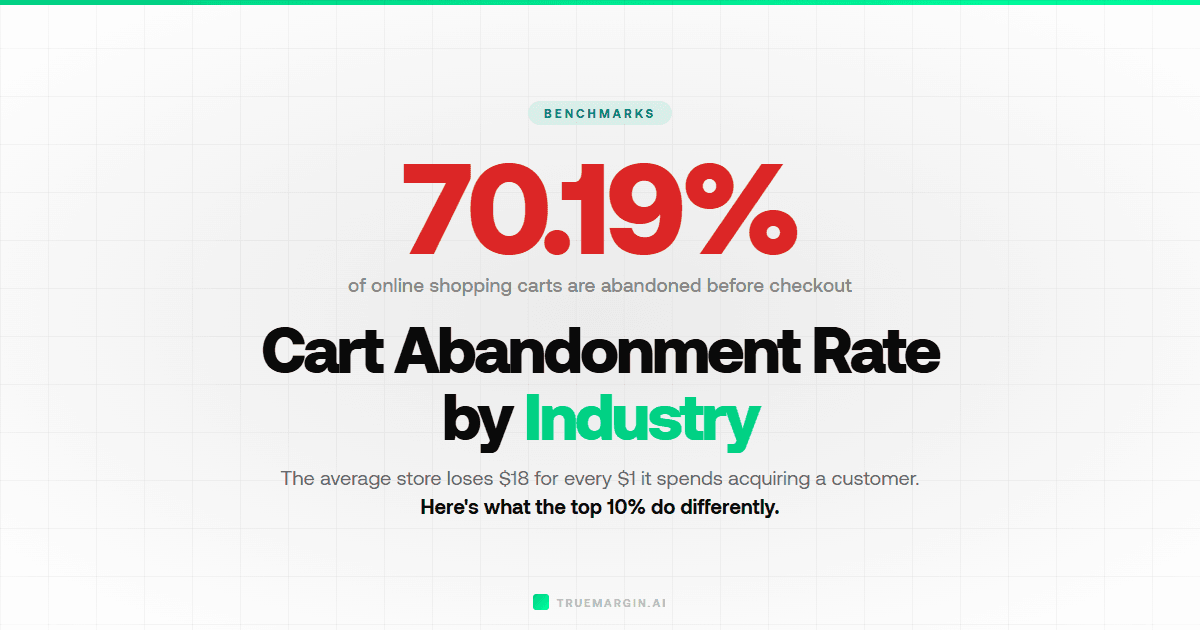
The average cart abandonment rate is 70.19% globally. That means for every 10 shoppers who add something to their cart, 7 of them leave without buying. And ecommerce businesses lose an estimated$18 billion per year because of it.
But a single average number hides massive differences across industries, devices, and checkout experiences. Below are the 2026 benchmarks you actually need — by industry, by device, and by root cause — sourced from Baymard Institute, Statista, Dynamic Yield, andContentsquare data.
Cart Abandonment Rate by Industry
Abandonment rates vary dramatically depending on what you sell. Higher price points, longer consideration cycles, and more comparison shopping all push abandonment up.
| Industry | Avg Abandonment Rate |
|---|---|
| Travel & Hospitality | 84.56% |
| Fashion & Apparel | 84.61% |
| Beauty & Personal Care | 82.32% |
| Luxury Goods | 78-82% |
| Electronics | 74-76% |
| Retail (General) | 72.23% |
| Health & Wellness | 68-72% |
| Food & Grocery | 62-65% |
| Pharmaceuticals | 57.31% |
| Pet Care | 52.49% |
The spread is massive — over 30 percentage points between pet care (52.49%) and fashion (84.61%). If you run a fashion brand and your abandonment rate is 80%, you're actually close to average. If you run a pet care store at 80%, something is seriously wrong.
The pattern: industries with lower AOV and repeat-purchase behavior (pet care, groceries, pharma) see much lower abandonment. High-ticket categories with comparison shopping (travel, luxury, electronics) see the highest.
Cart Abandonment Rate by Device
Device type is one of the biggest factors in abandonment — and the one most brands underestimate:
| Device | Abandonment Rate | % of Ecom Traffic |
|---|---|---|
| Mobile | 78-80% | 70-78% |
| Tablet | 70-71% | 3-5% |
| Desktop | 66-68% | 20-25% |
Mobile abandonment is 10-12 percentage points higher than desktop. And mobile accounts for 70%+ of all ecommerce traffic. That combination means the majority of your lost carts are happening on phones.
Why the gap? Smaller screens make product comparison harder. Typing payment and address information is painful on mobile. Checkout forms that work fine on desktop become frustrating on a 6-inch screen. And mobile users are more likely to be casually browsing — not in active buying mode.
The flip side: this is where your biggest opportunity lives. If you're running a store where mobile conversion rate is more than 2x lower than desktop, fixing your mobile checkout experience will move total revenue more than any ad campaign.
Top Reasons for Cart Abandonment
Baymard Institute has tracked cart abandonment reasons across dozens of studies. Here are the top causes, ranked by percentage of shoppers who cite them:
| Reason | % of Shoppers |
|---|---|
| Extra costs too high (shipping, tax, fees) | 48% |
| Just browsing / not ready to buy | 43% |
| Required account creation | 26% |
| Checkout too long or complicated | 22% |
| Couldn't calculate total cost upfront | 21% |
| Didn't trust site with credit card info | 17% |
| Delivery too slow | 16% |
| Return policy not satisfactory | 12% |
| Not enough payment methods | 9% |
| Card declined | 4% |
Two things jump out. The #1 reason — unexpected costs — is 100% preventable. If your product page shows $49.99 but checkout reveals $59.47 after shipping and tax, nearly half your customers will bail. Show total costs on the product page or offer free shipping.
Second: "just browsing" at 43% is not a fixable problem — it's natural shopping behavior. Many shoppers use carts as wish lists. The actionable reasons start at #3: forced account creation, long checkouts, trust issues. Those are things you can fix this week.
The Real Cost of Cart Abandonment
The numbers are staggering:
- $18 billion in lost revenue per year across ecommerce
- ~$4 trillion in total abandoned merchandise value annually
- A store doing $100K/month in revenue is losing an estimated $230K-$250K/month to abandoned carts
That last number comes from simple math. If your conversion rate is 2.5% and your cart abandonment rate is 70%, about 5.8% of visitors add to cart but don't buy. Each of those abandoned carts represents real purchase intent that evaporated between the "Add to Cart" button and the "Complete Purchase" button.
Even recovering 10-15% of those abandoned carts — which is realistic with basic email automation — can add 5-10% to your total revenue without spending a dollar more on advertising.
How much is cart abandonment actually costing you?
Plug in your traffic, conversion rate, and AOV to see how much revenue you're leaving on the table — and how much a small improvement is worth.
Open Conversion Rate Calculator →7 Proven Strategies to Reduce Cart Abandonment
Ranked by typical impact on abandonment rate, from highest to lowest:
1. Show All Costs Upfront
Since 48% of abandonment comes from unexpected costs, this is the single highest-impact fix. Show shipping costs on the product page. If you charge tax, include an estimate before checkout. Better yet — offer free shipping above a threshold. Free shipping alone can increase conversion rates by 20-30%.
2. Offer Guest Checkout
26% of shoppers abandon because they're forced to create an account. Offer guest checkout and ask for account creation after purchase, when the commitment is already made. You'll still capture their email from the order confirmation.
3. Simplify Your Checkout Flow
22% abandon because checkout is too long. Baymard Institute recommends a maximum of 8 form fields. Auto-fill addresses, use single-page checkout, show a progress indicator, and remove every field that isn't strictly necessary. Each extra step loses 10-15% of remaining buyers.
4. Add Multiple Payment Options
9% abandon because their preferred payment method isn't available. Support credit cards, PayPal, Apple Pay, Google Pay, and Shop Pay at minimum. Mobile wallets are especially important — they let customers skip manual form entry on phones, directly attacking the mobile abandonment gap.
5. Build Trust at Checkout
17% of shoppers don't trust the site with their credit card. Add SSL badges, accepted payment icons, and a clearly visible return policy near the payment form. Link to your return policy — generous return policies reduce perceived purchase risk.
6. Send Abandoned Cart Emails
This is the recovery strategy with the strongest data behind it. Abandoned cart emails achieve open rates up to 45% and click-through rates of around 21%. Roughly half of those who click through go on to complete their purchase.
Timing matters: send the first email within 1 hour of abandonment. Follow up at 24 hours and 72 hours. A 3-email sequence is the sweet spot — more than that and you're just annoying people. A good recovery rate from emails alone is 10-20% of abandoned carts.
7. Optimize Mobile Checkout
With mobile abandonment 10-12 points higher than desktop and mobile making up 70%+ of traffic, this is a huge lever. Use large tap targets, auto-fill, numeric keyboards for phone/zip fields, and mobile wallet buttons above the fold. Test your checkout on an actual phone — if anything requires pinching or zooming, it's losing you sales.
Cart Abandonment and Profit Margins
Cart abandonment doesn't just reduce revenue — it destroys your unit economics. Here's why:
You've already paid to get that shopper to your store. The ad cost is spent whether they buy or not. When they abandon, you've incurred the full customer acquisition cost with zero revenue. That drags down your ROAS and compresses your profit margins.
A simple example: if you spend $5,000/month on ads driving 10,000 visitors at a 2.5% conversion rate, you get 250 orders. If your abandonment rate is 70%, roughly 580 visitors added to cart but only 250 bought. Reducing abandonment by just 5 points — from 70% to 65% — would add approximately 40 more orders from the same ad spend. At a $60 AOV, that's $2,400 in additional monthly revenue at zero additional ad cost.
To see how abandonment rate improvements affect your bottom line, run your numbers through our profit margin calculator or Shopify profit calculator.
What Recovery Rate Should You Target?
An acceptable abandoned cart recovery rate is 10-20%. That means out of every 100 shoppers who abandon, you win back 10 to 20. Here's how the best stores get there:
| Recovery Method | Avg Recovery Rate | Best Practice |
|---|---|---|
| Abandoned cart emails | 10-15% | 3-email sequence within 72 hours |
| Exit-intent popups | 3-5% | Offer free shipping or small discount |
| SMS reminders | 2-4% | Single message within 1 hour |
| Retargeting ads | 2-3% | Show the exact products left in cart |
| Push notifications | 1-3% | Works best for repeat customers |
Stacking multiple recovery methods is how top stores hit 15-20%. Email alone gets you 10-15%. Add exit-intent popups and retargeting ads and you're pushing toward 20%. The math works out: even at a conservative 12% recovery rate on a store with 500 abandoned carts per month, that's 60 recovered orders you wouldn't have had otherwise.
Run Your Numbers
Industry benchmarks tell you where you stand. The real value is modeling your specific situation — traffic, conversion rate, AOV, abandonment rate, and margins — to see how each improvement compounds into profit.
Use our free conversion rate calculator to model how reducing abandonment changes your revenue. And to see how those gains flow through to your bottom line, try our profit margin calculator and Shopify profit calculator.
Frequently Asked Questions
What is the average cart abandonment rate?
The average cart abandonment rate is 70.19% globally in 2026. That means roughly 7 out of every 10 shoppers who add items to their cart leave without buying. Rates vary significantly by industry — pet care stores see around 52%, while fashion and travel exceed 84%.
What is the #1 reason for cart abandonment?
Unexpected extra costs at checkout — cited by 48% of shoppers. This includes shipping fees, taxes, and handling charges that weren't visible on the product page. Showing total costs upfront is the single most effective way to reduce abandonment.
Is cart abandonment higher on mobile or desktop?
Mobile cart abandonment (78-80%) is significantly higher than desktop (66-68%). The gap is driven by smaller screens making checkout harder, more difficult form entry, easier distraction, and more casual browsing behavior on phones. Since mobile accounts for 70%+ of ecommerce traffic, optimizing mobile checkout is one of the highest-ROI improvements you can make.
How much revenue do ecommerce businesses lose to cart abandonment?
Ecommerce businesses lose an estimated $18 billion per year to cart abandonment, with the total value of abandoned merchandise reaching roughly $4 trillion annually. However, businesses can recover 10-20% of that lost revenue through abandoned cart emails, exit-intent offers, and checkout optimization.
What is a good cart abandonment recovery rate?
A good cart abandonment recovery rate is 10-20%. The best recovery tool is abandoned cart emails — they achieve open rates up to 45% and click-through rates around 21%. Sending the first email within 1 hour of abandonment performs best. Stacking email with exit-intent popups and retargeting ads pushes recovery toward 20%.