
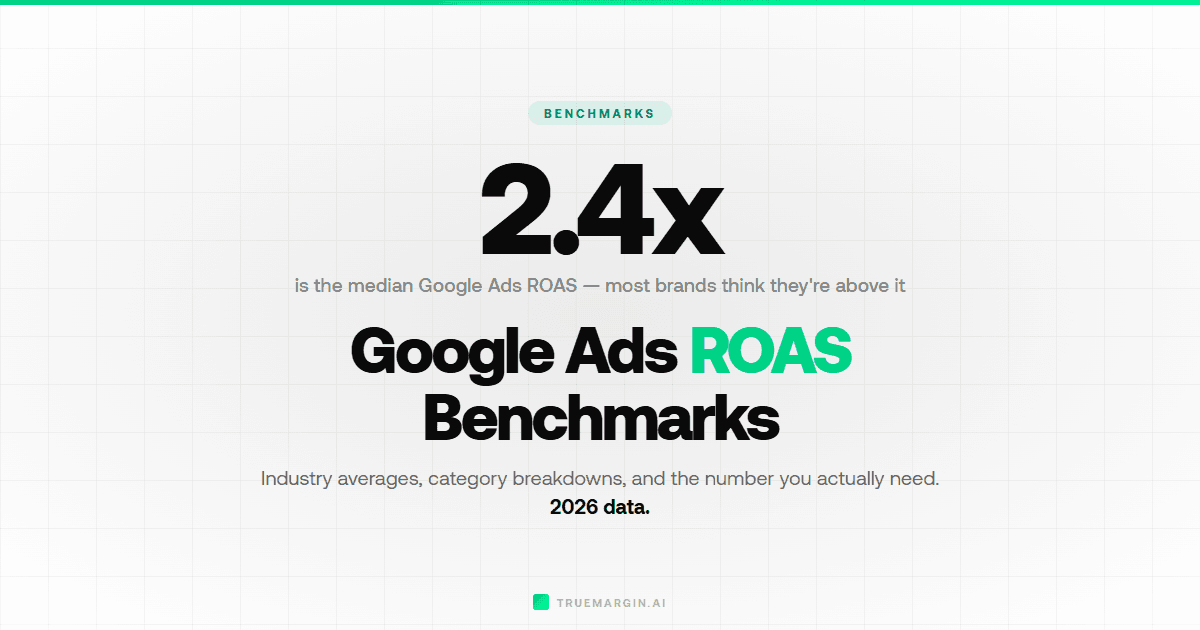
The average Google Ads ROAS for ecommerce is roughly 3.5x-4x. That means for every $1 spent on Google Ads, ecommerce brands earn roughly $3.50-$4.00 back in revenue. But that single number hides massive variation by campaign type, industry, and how well your account is set up.
This guide breaks down the real Google Ads ROAS benchmarks for 2026 — by campaign type, by ecommerce vertical, and compared head-to-head with Facebook Ads ROAS. If you're spending money on Google Ads and want to know where you stand, keep reading.
Google Ads ROAS by Campaign Type
Not all Google Ads campaigns perform equally. The campaign type you choose has a bigger impact on ROAS than almost any other variable. Here's how each format stacks up based on 2025-2026 data across thousands of ecommerce brands:
| Campaign Type | Average ROAS | Top Performers | Avg. CPC |
|---|---|---|---|
| Google Search | ~5x | 8x-10x+ | $0.90-$1.30 |
| Google Shopping | 4.0x-6.0x | 8x+ | $0.66 |
| Performance Max | 2.5x-3.0x | 5x+ | Varies |
| Display | 0.5x-1.5x | 2x+ | $0.30-$0.70 |
| YouTube | 2.0x-3.5x | 5x+ | $0.10-$0.30 |
Google Search delivers the highest ROAS at ~5x because users are actively searching with purchase intent. Someone typing "buy organic dog food" is a fundamentally different user than someone watching a YouTube video. That intent difference is worth 2x-3x the ROAS.
Google Shopping is the second-best performer and accounts for over 76% of all retail search ad spend, according to Adthena's research. The visual product listings, price, and review stars convert browsers into buyers faster than text-only Search ads.
Performance Max sits lower because it blends budget across Search, Shopping, Display, YouTube, and Gmail. The high-ROAS Search and Shopping placements carry the lower-performing Display impressions. If you're running Performance Max, be aware that brand traffic often inflates your reported ROAS — segment brand vs. non-brand to get an honest number.
Google Ads ROAS by Ecommerce Industry
Your vertical matters. A beauty brand and an electronics brand running identical campaigns will see wildly different returns. Here's how Google Ads ROAS breaks down by ecommerce category:
| Industry | Average Google Ads ROAS | 2025 Trend |
|---|---|---|
| Beauty & Personal Care | 3.5x | Declining |
| Food & Beverage | 3.2x | Declining |
| Consumer Electronics | 3.0x | Declining |
| Fashion & Apparel | 3.0x | Declining |
| Pets & Animals | 2.8x | Improving |
| Home & Garden | 2.5x | Declining |
| Health & Wellness | 2.1x | Declining |
ROAS declined across most ecommerce industries in 2025. Pets & Animals was one of the few bright spots, with modest ROAS improvement. The steepest drops hit Health & Wellness and Beauty — two verticals with surging competition and rising CPCs.
If your ROAS is below these averages, don't panic — but do audit your product feed quality, negative keywords, and landing page conversion rates. Those three factors explain most of the gap between average and top-performing accounts.
Google Ads vs. Facebook Ads ROAS: Head-to-Head
This is the comparison every ecommerce founder wants. Both platforms eat the bulk of most ad budgets — but they serve fundamentally different roles. Facebook Ads ROAS benchmarks tell one side of the story. Here's the full picture:
| Metric | Google Ads | Facebook (Meta) Ads |
|---|---|---|
| Average ROAS | 3.5x-4.5x | 2.0x-2.5x |
| Top Performer ROAS | 8x-10x+ | 6x+ |
| Average CPC | $0.66-$1.30 | $1.72 |
| Conversion Rate | 2.81% | 1.0%-3.0% |
| Average CPA | $35-$50 | $18-$55 |
| Best For | High-intent capture | Demand generation |
Google Ads delivers roughly 1.5x-2x the ROAS of Facebook Ads because of intent. Someone searching "buy [product name]" on Google is ready to purchase. Someone scrolling Instagram is not. That fundamental difference drives higher conversion rates and higher ROAS on Google.
But ROAS alone doesn't tell you where to spend. Facebook creates demand — it puts your product in front of people who didn't know they wanted it. Google captures demand — it catches buyers when they're ready to act. Most successful ecommerce brands need both.
Facebook retargeting campaigns typically deliver significantly higher ROAS than the average for prospecting. If you're comparing your Facebook CPA to your Google CPA, make sure you're comparing the same campaign types. Prospecting-to-prospecting, retargeting-to-retargeting.
Know your real ROAS — not just the platform's number
Plug in your revenue, ad spend, and margins to see your true ROAS, breakeven point, and profit per sale across Google and Facebook.
Open ROAS Calculator →Google Ads CPC and Conversion Rate Benchmarks
ROAS is the output. CPC and conversion rate are the inputs. If you're diagnosing why your ROAS is low, start here:
| Metric | Search Ads | Shopping Ads | Display Ads |
|---|---|---|---|
| Average CPC | $0.90-$1.30 | $0.66 | $0.30-$0.70 |
| Conversion Rate | 2.81% | 1.91% | 0.59% |
| Average CPA | $40-$50 | $35-$45 | $75+ |
Ecommerce CPCs on Google are surprisingly low compared to other industries. At $0.66-$1.30 per click, ecommerce advertisers pay some of the lowest CPCs on the platform. Legal, insurance, and finance verticals routinely pay $5-$15 per click according to WordStream's 2025 benchmarks.
The 2.81% conversion rate for Search and 1.91% for Shopping are healthy benchmarks according to WordStream's Shopping Ads data. If your conversion rate is below 1.5%, focus on your landing page before increasing ad spend — you're paying for traffic that isn't converting. Even a 0.5% improvement in conversion rate can meaningfully shift your overall ROAS.
One important trend from 2025, per Store Growers' 2026 benchmarks report: click-through rates have been rising, but conversion rates have been declining. More people clicked ads but fewer bought. This points to a landing page problem, not an ad problem. Your ads are doing their job — your site needs to close the deal.
Performance Max: What to Actually Expect
Performance Max has become Google's default recommendation for ecommerce advertisers. It automates bidding, targeting, and creative across every Google surface — Search, Shopping, Display, YouTube, Discover, and Gmail. But the results are mixed.
Performance Max averages 2.5x-3.0x ROAS for ecommerce. That's lower than Search (~5x) and Shopping (4x-6x) alone. The reason: Performance Max allocates budget across all placements, including low-converting Display and YouTube inventory, which drag down your blended ROAS.
Three things to watch with Performance Max:
- Brand traffic inflates ROAS. Performance Max often cannibalizes your brand Search traffic. If people were already searching your brand name, Performance Max takes credit for those high-ROAS conversions. Segment brand vs. non-brand to see the real incremental performance.
- Search campaigns still win head-to-head. When both Performance Max and Search campaigns are eligible for the same search terms, Search typically shows higher conversion rates. Don't replace dedicated Search campaigns with Performance Max — run them alongside.
- Setup quality matters more than automation. Properly configured Performance Max campaigns report significantly higher conversions. The variance is enormous because the campaign is only as good as your asset groups, audience signals, and product feed.
How to Improve Your Google Ads ROAS
If your ROAS is below benchmarks, focus on these levers in order of impact:
1. Fix your product feed. Google Shopping and Performance Max depend entirely on your product feed. Titles need to include the keywords people actually search for. Descriptions should be detailed. Images must be high-quality, white-background product shots. A poor feed means poor placements and wasted spend.
2. Add negative keywords aggressively. For Search campaigns, review your search terms report weekly. You're almost certainly paying for irrelevant clicks — people searching for "free," "DIY," or competitor brand names that don't convert. Every irrelevant click drags down your ROAS.
3. Improve your landing page conversion rate. The difference between a 1.5% and a 3.0% conversion rate is 2x the revenue from the same ad spend. Speed, mobile experience, clear pricing, and reviews on the page are the highest-impact changes.
4. Increase your average order value. Higher AOV directly increases ROAS without any changes to your ads. Bundles, upsells, and free-shipping thresholds above your current AOV are the fastest path. Use our profit margin calculator to model how AOV changes affect your bottom line.
5. Reallocate budget to top performers. If your Search campaign runs at 6x ROAS and your Display campaign runs at 0.8x, the math is simple. Shift budget toward what's working. Don't fund underperformers out of habit. Use our ad budget calculator to plan your allocation.
What ROAS Do You Actually Need?
The benchmarks above tell you what's average. But average doesn't mean profitable. Your profit margins determine what ROAS you need to actually make money.
Breakeven ROAS = 1 / gross profit margin.
| Gross Margin | Breakeven ROAS | Target ROAS (20% profit) |
|---|---|---|
| 20% | 5.0x | 6.25x |
| 30% | 3.33x | 4.17x |
| 40% | 2.5x | 3.13x |
| 50% | 2.0x | 2.5x |
| 60% | 1.67x | 2.08x |
| 70% | 1.43x | 1.79x |
A supplement brand with 70% margins can run profitably at 1.5x ROAS. An electronics brand with 20% margins needs 5x just to break even. This is why the roughly 3.5x-4x average ROAS on Google Ads is profitable for some brands and a money pit for others. Always calculate your breakeven ROAS before evaluating performance.
Don't forget to factor in returns, payment processing fees (2.9% + $0.30 per transaction), and overhead. A realistic breakeven ROAS is typically 20-30% higher than the simple formula suggests. Use our CPA calculator to see your true cost per acquisition across channels.
The Bottom Line
Google Ads is the highest-ROAS paid channel for most ecommerce brands. The roughly 3.5x-4x average beats Facebook's 2.0x-2.5x, and Google Search campaigns at ~5x are the single best-performing ad format in digital marketing.
But ROAS is declining. Most ecommerce industries saw lower returns in 2025, driven by rising CPCs and falling conversion rates. The brands winning on Google Ads in 2026 are the ones investing in product feed quality, landing page optimization, and smart budget allocation — not just throwing more money at Performance Max and hoping the algorithm figures it out.
Know your margins, know your breakeven ROAS, and track performance by campaign type — not just at the account level. That's the difference between a profitable Google Ads strategy and an expensive one.
Frequently Asked Questions
What is the average ROAS for Google Ads in ecommerce?
The average ROAS for Google Ads in ecommerce is roughly 3.5x-4x as of 2025-2026 data. However, this varies significantly by campaign type: Google Search ads average ~5x, Google Shopping averages 4x-6x, and Performance Max averages 2.5x-3x. Your actual ROAS depends on your industry, margins, and campaign structure.
Is Google Ads ROAS higher than Facebook Ads ROAS?
Yes. Google Ads averages roughly 3.5x-4.5x ROAS for ecommerce, while Facebook Ads averages 2.0x-2.5x. Google performs better because users are actively searching for products with purchase intent, whereas Facebook users are browsing passively. However, Facebook excels at reaching new audiences and driving top-of-funnel awareness that Google captures later.
What is a good ROAS for Google Shopping ads?
A good ROAS for Google Shopping ads is 4x-6x. The average sits around 4x, with top performers exceeding 8x. Google Shopping benefits from high purchase intent and visual product listings, making it one of the highest-converting ad formats in ecommerce. Product feed quality is the biggest lever for improving Shopping ROAS.
What ROAS should I expect from Performance Max campaigns?
Performance Max campaigns average 2.5x-3.0x ROAS for ecommerce. This is lower than Search or Shopping alone because Performance Max distributes budget across Search, Shopping, Display, YouTube, and Gmail. Brand traffic often inflates Performance Max ROAS, so segment brand vs. non-brand to get an accurate read.
Why is my Google Ads ROAS dropping?
Google Ads ROAS declined across most ecommerce industries in 2025. Rising CPCs, increased competition, and lower conversion rates are the primary drivers. To combat this, focus on product feed optimization, negative keyword management, landing page conversion rate, and shifting budget toward high-intent Search campaigns.